 |
|
|
|
|
|
|
| ||||||||||
|
|
|
|
|
|
|
||||
| ||||||||||
|
|
|
|
|
Persons using assistive technology might not be able to fully access information in this file. For assistance, please send e-mail to: mmwrq@cdc.gov. Type 508 Accommodation and the title of the report in the subject line of e-mail. Prevalence of Selected Maternal and Infant Characteristics, Pregnancy Risk Assessment Monitoring System (PRAMS), 1997PRAMS Working Group L. Albert Woolbright, Ph.D. Kathy Perham-Hester, M.S., M.P.H. Gina Redford, M.A.P. Darci Cherry, M.P.H. Richard Hopkins, M.D., M.S.P.H. Leslie Lipscomb, M.P.H. Bruce Steiner Suzanne Kim, M.P.H. Martha Henson Susan Nalder, Ed.D., M.P.H. Michael Medvesky, M.P.H. Michelle Beck-Warden, M.S. Jo Bouchard, M.P.H. Richard Lorenz Kristen Helms, M.S.P.H. Nan Streeter, M.S. Linda Lohdefinck Melissa Baker, M.A. Prevalence of Selected Maternal and Infant Characteristics, Pregnancy Risk Assessment Monitoring System (PRAMS), 1997 Brenda J. Colley Gilbert, Ph.D., M.S.P.H.1 1 Division of Reproductive HealthNational Center for Chronic Disease Prevention and Health Promotion 2Klemm Analysis Group, Atlanta, GA Abstract Problem/Condition: Certain maternal behaviors and experiences (e.g., unintended pregnancy, late entry into prenatal care, smoking cigarettes during pregnancy, and physical abuse during pregnancy) might be related to adverse reproductive outcomes (e.g., low birthweight, infant morbidity and mortality, and maternal morbidity). Information on the prevalence of these behaviors and experiences is needed to monitor trends over time, to increase understanding of maternal behaviors and experiences and their relation to perinatal and maternal outcomes, and to develop and assess programs and policies designed to reduce these adverse outcomes among pregnant women and their infants. Reporting Period: From 1993 through 1997. Description of System: The Pregnancy Risk Assessment Monitoring System (PRAMS) is a CDC-developed, ongoing, state- and population-based surveillance system designed to collect information on self-reported maternal behaviors and experiences that occur before, during, and shortly after pregnancy among women who deliver a live-born infant. A 14-page questionnaire is mailed to a sample of mothers that is randomly selected from state birth certificate records. The questionnaire is followed by two additional mailings and follow-up with nonresponders by telephone. Responses are accumulated during the calendar year, combined with birth certificate data, and then weighted to be representative of all mothers who had a live-born infant in the state. Data for 1997 from 13 states were examined. Results: The prevalence of unintended pregnancy resulting in a live-born infant ranged from 33.9% to 50.0% in the 13 states. From 1993 through 1997, data from Georgia demonstrated a significant decreasing trend (p = .01) in unintended pregnancy, whereas this trend significantly increased in New York (p = .03). In most states, women who were younger (aged less than 20 years), had less than 12 years of education, were black, and received Medicaid were more likely to report an unintended pregnancy. In 1997, 16.6%-30.7% of women entered prenatal care after the first 3 months of pregnancy. In most states, women who were younger (aged less than 20 years), black, had lower levels of education, and received Medicaid were more likely to enter prenatal care late or not at all. Georgia and Washington experienced significant decreasing trends in smoking during pregnancy. Across the 13 states, 11.0%-23.9% of women reported smoking during pregnancy. In seven of 13 states, white women were more likely to smoke during pregnancy than black women. In eight of 13 states, smoking was significantly more prevalent among women who delivered a low birthweight infant than women who delivered a normal weight infant. In seven states, the proportion of women who initiated breast-feeding significantly increased from 1993 through 1997; the prevalence in 1997 ranged from 48.1% to 86.8%. Women who were most likely to breast-feed were older, more educated, white, and did not receive Medicaid. The state-specific prevalence of physical abuse during pregnancy by a husband or partner ranged from 2.4% to 5.6%. In most of these states, women who had less than a high school education and women who received Medicaid were more likely to report having been abused. Interpretation: Findings indicate that many women report high-risk behaviors or experience high-risk conditions before, during, and shortly after pregnancy. Furthermore, several specific groups of women were significantly more likely to report these behaviors or experience these conditions. In many states, women who were younger, less educated, and Medicaid recipients were more likely to experience unintended pregnancy, enter prenatal care after the first 3 months of pregnancy or not at all, smoke during the last 3 months of pregnancy, and never initiate breast-feeding. Public Health Action: These findings are useful for state agencies to monitor trends in behaviors and experiences and to design public health programs and policies that address these behaviors and experiences so that the health of mothers and their infants is improved. INTRODUCTION Certain maternal behaviors and experiences (i.e., unintended pregnancy, late entry into prenatal care, smoking cigarettes during pregnancy, and physical abuse during pregnancy) might be associated with increased risk for adverse perinatal and maternal outcomes (e.g., low birthweight, infant morbidity and mortality, and maternal morbidity) (1-4). The Pregnancy Risk Assessment Monitoring System (PRAMS) is a CDC-developed, ongoing, state- and population-based surveillance system that identifies and monitors selected self-reported maternal behaviors and experiences that occur before, during, and shortly after pregnancy among women who deliver a live-born infant. The PRAMS questionnaire addresses several behaviors and experiences. Six maternal and child health (MCH) topics were selected for this report: a) intendedness of pregnancy, b) use of contraception at time of pregnancy among women who report an unintended pregnancy, c) entry into prenatal care after the first 3 months of pregnancy or no prenatal care, d) maternal use of cigarettes during the last 3 months of pregnancy, e) physical abuse during pregnancy by a husband or partner, and f) breast-feeding initiation. Most of these topics are included in the year 2000 national health objectives (which include the year 2000 healthy children national health objectives) (1,5) or are reporting requirements for the Title V Maternal and Child Health Block Grant, a major funding source for state MCH programs. This report includes both multistate and state-specific analyses of PRAMS data. Prevalence estimates for 1997 and trend data for 1993 through 1997 are presented by state for these six high-risk behaviors and experiences. For 1997, subgroup analyses (i.e., by age, race, ethnicity, education, Medicaid status, infant birthweight, and parity) are presented for each of the six topics. Reports that highlight key findings about PRAMS for previous years are also available (6,7). METHODS Overview of PRAMS When PRAMS was first implemented in 1987, five states and the District of Columbia participated. In 1991, eight states were added; during 1996-1997, six more states joined PRAMS and began collecting data in 1997. In 1999, two states began participating in PRAMS. The 18 current PRAMS participants are Alabama, Alaska, Arkansas, Colorado, Florida, Georgia, Illinois, Louisiana, Maine, New Mexico, New York, North Carolina, Ohio, Oklahoma, South Carolina, Utah, Washington, and West Virginia. Live births in these states represent approximately one third of all live births in the United States. In state health departments, PRAMS program structures cross several existing organizational units, including MCH and vital statistics. PRAMS generates statewide estimates of important perinatal and maternal health indicators among women who delivered a live-born infant. Because PRAMS data are population-based, findings are generalizable to an entire state's population of women who delivered a live-born infant. Each participating state uses a standardized data collection protocol developed by CDC (CDC, unpublished data, 1996). PRAMS staff in each state collect data through statewide mailings and follow-up with nonresponders by telephone. Each month, a stratified sample of 100-250 new mothers is selected from eligible birth certificates. Each mother in the sample is mailed a letter that introduces the survey as well as a 14-page questionnaire approximately 2-6 months after delivery. A second questionnaire packet (and in most states a third) is mailed to mothers who do not respond. PRAMS staff telephone mothers who do not respond to the mailed questionnaire and interview them by phone. The current questionnaire is based on revisions made to the questionnaire in 1995 and introduced in the field in late 1995 and early 1996. Additional details about the PRAMS methodology have been described in other reports (8). Technical Notes Data in this report were collected from 13 states (Alabama, Alaska, Arkansas, Colorado, Florida, Georgia, Maine, New York, North Carolina, Oklahoma, South Carolina, Washington, and West Virginia). These states fully implemented PRAMS data collection procedures and achieved response rates of approximately greater than or equal to 70% (Appendix). Data from 1997 are used in the tables that present estimates by state with associated 95% confidence intervals. For North Carolina, the 1997 data represent only a partial year. Data for New York do not include New York City. Out-of-state births (except for Alaska) and out-of-state residents were excluded. The multistate tables of trends include data from 1993 through 1997 for states that had multiple years of data. Data for 1993 were not available for Washington. Since the inception of PRAMS, three separate questionnaires have been developed and used. The Phase 3 questionnaire was implemented in late 1995 in Maine, South Carolina, and West Virginia, and in all other PRAMS states in early 1996. The topic, use of contraception at time of pregnancy, first appeared on the Phase 3 questionnaire; the wording of the Phase 3 questions on the physical abuse topic changed substantially from the Phase 2 version. Thus, for these two topics, trend data are available for only 1996 and 1997. Arkansas, Colorado, and North Carolina began collecting data in 1997; thus, only this year is available, and these states were not included in the tables depicting trends. Georgia and New York supplemented the mail and telephone methodology with hospital-based surveillance during 1993-1996. Mothers were randomly selected from hospital delivery logs and interviewed before they left the hospital. They were given a self-administered questionnaire (within 48 hours of delivery) addressing events that occurred before pregnancy, and during pregnancy and delivery. Two months after delivery, a second questionnaire addressing events that occurred since the delivery was sent to these mothers. Data on maternal and infant characteristics (i.e., age, race, ethnicity, education, infant birthweight, and parity) were taken from birth certificate records and combined with the PRAMS questionnaire responses to create the PRAMS analysis files for each participating state. The data were weighted to adjust for survey design, nonresponse, and noncoverage. Percentages and standard errors were calculated using SUDAAN (9). In the tables that indicate prevalence by state, the number of respondents refers to the number of mothers who answered the corresponding PRAMS question. In the tables that indicate prevalence by selected characteristics, Medicaid recipient is defined as a mother who reported that she was on Medicaid when she got pregnant or a mother who reported that Medicaid paid for her prenatal care or delivery. All missing data (i.e., questions a mother left blank, refused to answer, or responded with "don't know") were excluded; the percentage of missing data was noted when it was greater than or equal to 10%. Because estimates based on small samples are imprecise and might be biased, estimates where the underlying number of respondents was less than or equal to 30 were not reported. In the tables that present data from 1993 through 1997, the p value indicates a test for linear trend and was considered significant when p less than .05. The p value was calculated using PROC LOGISTIC in SUDAAN. In the tables that present prevalences by selected characteristics, differences were defined as significant when the 95% confidence intervals did not overlap. RESULTS Unintended Pregnancy Women who delivered a live-born infant were asked how they felt about getting pregnant just before they became pregnant. Intended pregnancies are those for which a woman reported that she wanted to be pregnant then or sooner, whereas unintended pregnancies refer to pregnancies for which a woman either wanted to be pregnant later (mistimed) or did not want to be pregnant at any time (unwanted). For 1997, the prevalence of unintended pregnancy among women who delivered a live-born infant ranged from 33.9% to 50.0% across the 13 states (Table 1). The prevalence was highest in Oklahoma and South Carolina and lowest in Maine (Figure 1). Georgia demonstrated a significant decreasing trend (p = .01) in the prevalence of unintended pregnancy among women having a live-born infant from 1993 through 1997; New York demonstrated a significant increasing trend (p = .03) during the same period; and the other states remained the same (Table 2). The prevalence of unintended pregnancy among women who had a live-born infant varied by selected maternal characteristics (Table 3). In all 13 states, unintended pregnancy was more prevalent among younger women (aged less than 20 years) than older women (aged greater than or equal to 20 years). In most states, unintended pregnancy resulting in live-born infants decreased as maternal age increased. In addition, in most states, unintended pregnancy resulting in a live-born infant was significantly more prevalent among women who had less than 12 years of education than women with more years of education, and the prevalence decreased as years of education increased. In nine of 13 states, the prevalence of unintended pregnancy among women having a live-born infant was significantly higher among black women than white women. In Oklahoma, Hispanic women were significantly less likely to report an unintended pregnancy resulting in a live-born infant than non-Hispanic women. In each of the 13 states, women who received Medicaid were significantly more likely to report an unintended pregnancy resulting in a live-born infant than women who did not receive Medicaid. No differences were noted in the prevalence of unintended pregnancy by birthweight (low versus normal) or parity. Use of Contraception at Time of Pregnancy Among Women Reporting an Unintended Pregnancy Women who reported that their pregnancy was unintended were asked if they were using any method of contraception when they got pregnant. In 1997, 37.0%-48.3% of women who had an unintended pregnancy reported that they were using contraception when they got pregnant (Table 4). The prevalence was lowest in Arkansas and highest in Maine (Figure 2). Data for the topic were available only for 1996 and 1997; no significant changes in any state were noted for these years (Table 5). No significant differences in use of contraception at time of pregnancy were noted across the 13 states among women reporting an unintended pregnancy by age, race, or ethnicity. In Alaska and Florida, for women who had an unintended pregnancy, the prevalence of use of contraception at time of pregnancy among women who had greater than 12 years of education was significantly higher than among women who had 12 years of education. Use of contraception at time of pregnancy did not differ according to Medicaid status, infant birthweight, or parity among women who had an unintended pregnancy resulting in a live-born infant (Table 6). Entry into Prenatal Care After the First 3 Months of Pregnancy In 1997, 16.6%-30.7% of women reported beginning prenatal care after the first 3 months of their pregnancy or having received no prenatal care (Table 7). The prevalence of late entry into prenatal care was lowest in Maine and highest in Oklahoma (Figure 3). For the period 1993 through 1997, the prevalence of late entry into prenatal care significantly declined in eight of the 10 states with available data (Table 8). No significant trends were evident in Oklahoma and Washington. In all 13 states, the prevalence of late entry into prenatal care was highest among younger women (aged less than 20 years). In seven states (Alabama, Florida, Georgia, New York, North Carolina, South Carolina, and West Virginia), late entry into prenatal care was significantly higher among black women than white women. In addition, in Colorado and Florida, the prevalence of late entry into prenatal care for women of other races was higher than the prevalence for white women. In Colorado, Georgia, New York, and Washington, Hispanic women reported a significantly higher prevalence of late entry into prenatal care than non-Hispanic women living in these four states. Generally, the prevalence of late entry declined as the level of education increased. In all 13 states, the prevalence of late entry into prenatal care was significantly higher among women who received Medicaid compared with women who did not receive Medicaid. The prevalence of late entry into prenatal care did not differ by infant birthweight (low versus normal) or by parity (Table 9). Smoking During the Last 3 Months of Pregnancy In 1997, the prevalence of smoking cigarettes in the last 3 months of pregnancy ranged from 11.0% to 23.9% (Table 10). The prevalence was highest in West Virginia and lowest in Georgia (Figure 4). From 1993 through 1997, the proportion of women who smoked during the last 3 months of pregnancy decreased significantly in Georgia and Washington (Table 11). In 1997, among women aged less than 20 years, the prevalence of smoking during pregnancy ranged from 10.2% in North Carolina to 37.9% in Maine. The prevalence of smoking during pregnancy varied significantly among age groups in Alaska, Maine, Oklahoma, Washington, and West Virginia; younger women (aged 20-24 years) were more likely to smoke than older women (aged 25-34 years). In seven of 13 states, white women were significantly more likely to have reported smoking during pregnancy than black women (Table 12). In Alaska, women of other races (predominantly Alaskan Natives) were more likely to smoke than white women or black women. The prevalence of smoking during pregnancy was significantly lower among Hispanic women than non-Hispanic women in Alaska, Colorado, Florida, Oklahoma, and Washington. In all 13 states, the prevalence of smoking during the last 3 months of pregnancy declined as level of education increased. In all states except Oklahoma, the prevalence of smoking during pregnancy was significantly higher among Medicaid recipients than women who did not receive Medicaid. In eight of the 13 states, the prevalence of smoking during pregnancy was significantly higher among women who delivered a low birthweight infant than among women who delivered a normal birthweight infant. When parity was considered, Alabama was the only state where the prevalence of smoking during pregnancy varied significantly; in Alabama, the prevalence of smoking during the last 3 months of pregnancy among mothers who had a second or later birth was significantly higher than among first-time mothers (Table 12). Physical Abuse by a Husband or Partner During Pregnancy Women were asked if they had been physically abused by a husband or partner during their most recent pregnancy. Physical abuse was defined as being hit, slapped, kicked, or physically hurt in any way. In 1997, the prevalence of physical abuse by a husband or partner during pregnancy ranged from 2.4% to 5.6% (Table 13). The prevalence was lowest in Washington and highest in South Carolina (Figure 5). Data for this indicator were available only for 1996 and 1997; no significant changes were noted during this period for any state (Table 14). For seven of 13 states, data examined by age group indicated significant differences in the prevalence of physical abuse by a husband or partner during pregnancy; however, no consistent patterns were noted among states. In Alaska, Florida, and Washington, significant differences in physical abuse during pregnancy by race were observed. In Alaska, women of other races were significantly more likely to report physical abuse by a husband or partner during pregnancy than white women. In Florida, women of other races were significantly less likely to report physical abuse by a husband or partner during pregnancy than white women or black women. In Washington, black women were significantly more likely to report physical abuse by a husband or partner during pregnancy than white women. Colorado was the only state to report a significantly higher prevalence of physical abuse by a husband or partner during pregnancy among Hispanic women than non-Hispanic women. In nine of the 13 states, the prevalence of physical abuse by a husband or partner during pregnancy varied significantly by education. In eight states, the prevalence was significantly higher among women who had less than 12 years of education than women who had greater than 12 years. In nine states, the prevalence of physical abuse by a husband or partner during pregnancy was significantly higher among women who received Medicaid than women who did not receive Medicaid. Alaska was the only state where the prevalence varied significantly by infant birthweight; in Alaska, the prevalence of physical abuse by a husband or partner during pregnancy was significantly higher among women who delivered a low birthweight infant than women who delivered a normal birthweight infant. No significant differences in prevalence were noted by parity (Table 15). Breast-feeding Initiation Breast-feeding initiation was defined as ever trying to breast-feed the new infant. For 1997, the state range was 48.1%-86.8% for initiating breast-feeding (Table 16). The prevalence of breast-feeding initiation was highest in Washington, followed closely by Alaska, and was lowest in Alabama and West Virginia (Figure 6). Breast-feeding initiation significantly increased over time in seven states (Alaska, Florida, Georgia, Maine, New York, South Carolina, and Washington) (Table 17). In most of the 13 states, the prevalence of breast-feeding initiation increased as the age of the mother increased. The pattern was similar for education level; in most states, the prevalence of breast-feeding initiation increased as the level of education increased. In nine states, the prevalence of breast-feeding initiation varied significantly by race; in eight states, the prevalence was significantly higher among white women than black women. In Florida, the prevalence of breast-feeding initiation was significantly higher among Hispanic women than non-Hispanic women. Except for the state of Washington, initiation of breast-feeding was significantly less prevalent among women who received Medicaid than women who did not receive Medicaid. In seven states, breast-feeding initiation varied significantly by infant birthweight; breast-feeding initiation was significantly higher among women who delivered a normal birthweight (greater than or equal to 2,500 grams) infant than among women who delivered a low birthweight (less than 2,500 grams) infant. First-time mothers in Georgia and South Carolina were significantly more likely to report initiating breast-feeding than mothers who had two or more births (Table 18). DISCUSSION Trend data for two of the six topics (i.e., entry into prenatal care after the first 3 months of pregnancy or no prenatal care and breast-feeding initiation) indicate that significant progress has been made in most states during the period 1993 through 1997 in improving early entry into prenatal care and expanding initiation of breast-feeding. Despite this progress, a wide disparity still exists between states in the prevalences of these two behaviors, and the year 2000 national health objectives will likely not be met by most of these states. Trend results were mixed or mostly unchanged for two of the topics (i.e., intendedness of pregnancy and maternal use of cigarettes during the last 3 months of pregnancy). Few, if any of these states, will likely meet the year 2000 national health objectives for unintended pregnancy or smoking during pregnancy. Results for the other two topics (i.e., use of contraception at time of pregnancy among women who report an unintended pregnancy and physical abuse during pregnancy by a husband or partner) for which only 2 years of data were available indicated no significant change during this period for any state. No specific year 2000 national health objectives are associated with contraceptive use at time of pregnancy or physical abuse during pregnancy. Eight of the 10 states experienced significant decreases over time in the prevalence of women entering prenatal care after the first 3 months of pregnancy. The prevalence of late entry into prenatal care ranged from 16.6% to 30.7%. In most states, women who were younger, black, had lower levels of education, and received Medicaid were more likely to enter prenatal care late or not at all. Entry into prenatal care during the first 3 months of pregnancy can a) help assure early identification of maternal disease and risks for complications of pregnancy or birth and b) provide opportunities for women to receive counseling about the risks of health behaviors that can contribute to adverse perinatal and maternal outcomes (3,4). The year 2000 national health objective is for greater than or equal to 90% of women to receive prenatal care in the first 3 months of pregnancy. Despite the decreases in late entry into prenatal care, none of the PRAMS states had reached the year 2000 national health objective by 1997. The Title V Block Grant Measurement Performance System also contains the topic, late entry into prenatal care, as one of the national core performance measures. Under the needs assessment feature of this block grant, states develop 5-year performance objectives and report progress each year (10). In seven states, trends in the initiation of breast-feeding increased significantly during the 5-year period; for 1997, prevalences ranged from 48.1% to 86.8%. Women who were most likely to initiate breast-feeding were older, more educated, white, not receiving Medicaid, and delivered a normal birthweight infant. Similar results were found in a 1995 national study of breast-feeding practices; breast-feeding initiation was highest among women who were older (aged greater than or equal to 35 years), in the highest annual income group (greater than or equal to $25,000) and college educated, nonparticipants in the Special Supplemental Nutrition Program for Women, Infants, and Children (WIC), and residing in the Western United States (11). The decision to breast-feed is part of a broader cultural context of community norms and values, which involve social and family support and personal networks (12). Researchers have found that prenatal education, support from a lactation specialist, and ongoing postpartum support are important for successful initiation and continuation of breast-feeding, especially among low-income women. Women who deliver a low birthweight infant encounter added barriers to initiating breast-feeding and might need additional support (13-15). The year 2000 national health objective is for greater than or equal to 75% of women to breast-feed in the early postpartum period; by 1997, Alaska, Colorado, and Washington had achieved this objective. This indicator is also one of the national core performance measures (i.e., breast-feeding measured at hospital discharge) in the Title V Block Grant Measurement Performance System (10). In 1997, the prevalence of unintended pregnancy among women who delivered a live-born infant ranged from 33.9% to 50.0%. Data from the National Survey of Family Growth (NSFG) for 1995 [the most recent NSFG conducted] indicated a prevalence of 31% for unintended pregnancy among women who delivered a live-born infant (16). The year 2000 national health objective is for the prevalence of unintended pregnancy to be less than or equal to 30% of all pregnancies (not just live births). The relation between unintended pregnancy and adverse reproductive outcomes (e.g., low birthweight and prematurity) is still unclear. Researchers reported that the proportion of infants born with an adverse birth outcome (i.e., premature infant, low birthweight infant, or infant who is small for gestational age) was significantly lower if the pregnancy was intended than if it was mistimed or not wanted. However, after adjusting data for maternal characteristics and prenatal behaviors, data indicated that a mistimed or unwanted pregnancy had no significant effect on any of these outcomes (2). Although for 1993 through 1997, significant decreasing trends in smoking during pregnancy occurred in Georgia and Washington, in 1997, 11.0%-23.9% of women in all 13 states reported smoking during pregnancy. In seven states, white women were significantly more likely to smoke during the last 3 months of pregnancy than black women; women who had lower levels of education and women who received Medicaid were also significantly more likely to smoke during pregnancy. In eight of 13 states, smoking was significantly more prevalent among women who had a low birthweight infant than among women who had a normal birthweight infant. Analysis of all U.S. births in 1997 revealed similar findings. The prevalence of smoking during pregnancy (reported on birth certificates) was lower among blacks than whites; rates of smoking were highest for women with 9-11 years of education and lowest for women with greater than or equal to 4 years of college; and a greater proportion of infants born to mothers who smoked were low birthweight than infants born to nonsmoking mothers (17). Birth certificate analysis also indicated that the prevalence of smoking during pregnancy was 13.6% in 1996 (18). This study documented that the rate of smoking during pregnancy declined between 1990 and 1996. However, both the PRAMS and the birth certificate estimate exceed the year 2000 national health objective of less than or equal to 10% of pregnant women reporting having smoked during pregnancy. Only 2 years (1996 and 1997) of data were available for the two remaining topics, use of contraception at time of pregnancy among women who report an unintended pregnancy and physical abuse during pregnancy by a husband or partner. For this 2-year period, no significant changes were observed. Among women who reported an unintended pregnancy resulting in a live-born infant, 37.0%-48.3% reported using a method of contraception at time of pregnancy. For most of the maternal and infant characteristics that were examined, no significant differences were observed in use of contraception at time of pregnancy among women who reported an unintended pregnancy. Level of education was the only characteristic associated with using contra- ception at time of pregnancy among this population; in Alaska and Florida, women who had greater than 12 years of education were significantly more likely to have used contraception at the time of pregnancy than women who had a high school education. The prevalence of use of contraception at time of pregnancy among women who reported an unintended pregnancy could be influenced by several factors, including the effectiveness of the method of contraception used and the consistency of use of the method. In addition, the wording of the question regarding use of contraception at time of pregnancy might also influence responses. Although the question refers to the time immediately around conception, women might respond regarding a broader time period or regarding their general use of a contraceptive method. In addition, the use of contraception might be different among women whose pregnancy was mistimed than among women whose pregnancy was unwanted. In the 13 states, the prevalence of physical abuse by a husband or partner during pregnancy ranged from 2.4% to 5.6%. Other researchers have reported that the prevalence of women who experienced violence during pregnancy was between 0.9% and 20.1%; most studies indicated a range from 3.9% to 8.3% (19). The prevalence of physical abuse by a husband or partner during pregnancy varied in some states by maternal age, race, and ethnicity. In most states, women who had less than a high school education and women who received Medicaid were more likely to report having been abused. In Alaska, the prevalence of abuse was higher among women who had a low birthweight infant than women who had a normal birthweight infant. These findings are consistent with other studies indicating that women who are physically abused have lower incomes and less education (19). Economically or socially advantaged women might be more likely to underreport physical abuse (20). Several limitations exist in this report. Information is based on self-reporting and might be subject to recall bias. Sociodemographic characteristics of respondents (e.g., education level) can influence interpretation of these questions. Nonresponse bias for which weighting procedures do not completely compensate (e.g., income level) could explain additional variations in the prevalences of these behaviors and experiences. In addition, these data represent only the behaviors and experiences of women whose pregnancies resulted in live-born infants and might not reflect the experiences of all pregnant women. Findings from PRAMS data that address only women delivering a live-born infant could underestimate the impact of these behaviors and experiences on all women who become pregnant. Moreover, results from these 13 states are not generalizable to other states. The variations across states in the prevalences of these six behaviors and experiences might be attributed to a) the type and comprehensiveness of health service programs and policies, b) variations in the availability and access of prenatal health care, and c) differences in population characteristics. Race is not a risk factor but is likely a marker for other sociodemographic factors (e.g., income, education, availability of and access to services, and family and social support) that are associated with unintended pregnancy, entry into prenatal care, smoking, and breast-feeding (2,3,11,13,17). Findings from these 13 states indicate that many women report high-risk behaviors or experience high-risk conditions before, during, and shortly after pregnancy. Also, several specific groups of women were significantly more likely to have reported these behaviors or experienced these conditions. Findings from this analysis can be used to enhance our understanding of these maternal behaviors and experiences and their relation to perinatal and maternal outcomes. States can use this information to develop new programs or modify existing programs to more effectively meet the needs of women who exhibit high-risk behaviors or experience high-risk conditions and therefore might be at increased risk for adverse pregnancy outcomes. References
Table 1 Note: To print large tables and graphs users may have to change their printer settings to landscape and use a small font size. TABLE 1. Prevalence of unintended pregnancy among women delivering a live-born infant* -- 13 states, Pregnancy Risk Assessment Monitoring System (PRAMS), 1997
* Unintended pregnancy among women delivering a live-born infant refers to pregnancies for which a woman either wanted to be pregnant later (mistimed) or did not want to be pregnant at any time (unwanted). Return to top. Figure 1 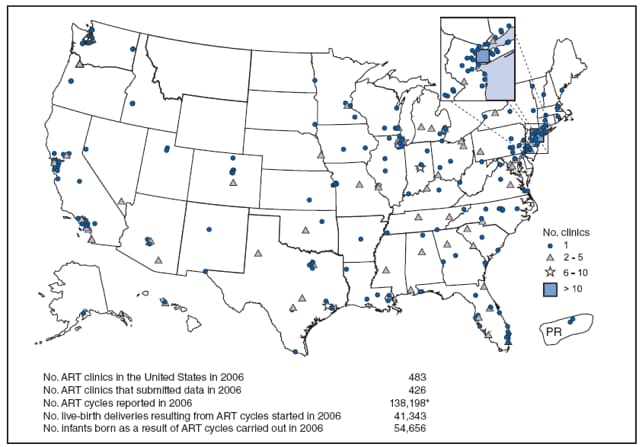 Return to top. Table 2 Note: To print large tables and graphs users may have to change their printer settings to landscape and use a small font size. TABLE 2. Prevalence of unintended pregnancy among women delivering a live-born infant* -- 10 states, Pregnancy Risk Assessment Monitoring System (PRAMS), 1993-1997
* Unintended pregnancy among women delivering a live-born infant refers to pregnancies for which a woman either wanted to be pregnant later (mistimed) or did not want to be pregnant at any time(unwanted). Return to top. Figure 2  Return to top. Table 3 Note: To print large tables and graphs users may have to change their printer settings to landscape and use a small font size. TABLE 3. Prevalence of unintended pregnancy among women delivering a live-born infant*, by selected maternal characteristics -- 13 states, Pregnancy Risk Assessment Monitoring System (PRAMS), 1997
* Unintended pregnancy among women delivering a live-born infant refers to pregnancies for which a woman either wanted to be pregnant later (mistimed) or did not want to be pregnant at any time (unwanted). Return to top. Figure 3 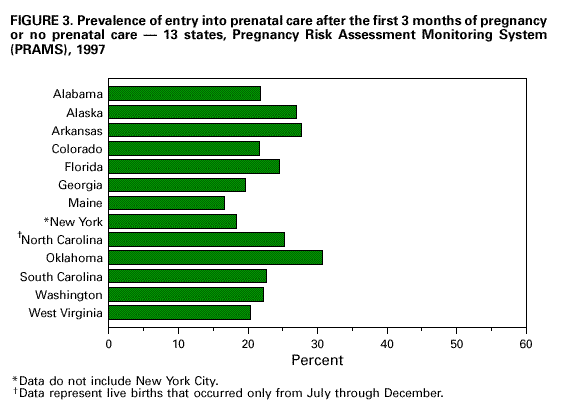 Return to top. Table 4 Note: To print large tables and graphs users may have to change their printer settings to landscape and use a small font size. TABLE 4. Prevalence of using contraception at time of pregnancy, among women who reported an unintended pregnancy* -- 13 states, Pregnancy Risk Assessment Monitoring System (PRAMS), 1997
* Unintended pregnancy among women delivering a live-born infant refers to pregnancies for which a woman either wanted to be pregnant later (mistimed) or did not want to be pregnant at any time (unwanted). Return to top. Figure 4 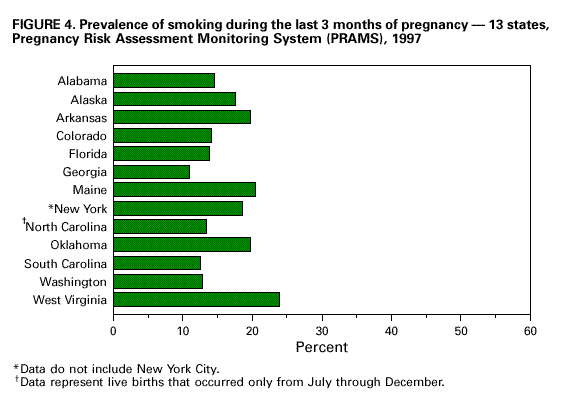 Return to top. Table 5 Note: To print large tables and graphs users may have to change their printer settings to landscape and use a small font size. TABLE 5. Prevalence of using contraception at time of pregnancy, among women who reported an unintended pregnancy* -- 10 states, Pregnancy Risk Assessment Monitoring System (PRAMS), 1996-1997
* Unintended pregnancy among women delivering a live-born infant refers to pregnancies for which a woman either wanted to be pregnant later (mistimed) or did not want to be pregnant at any time (unwanted). Return to top. Figure 5 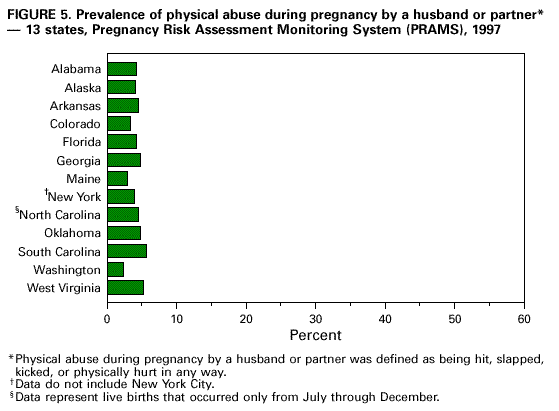 Return to top. Table 6 Note: To print large tables and graphs users may have to change their printer settings to landscape and use a small font size. TABLE 6. Prevalence of using contraception at time of pregnancy among women who reported an unintended pregnancy*, by selected maternal characteristics -- 13 states, Pregnancy Risk Assessment Monitoring System (PRAMS), 1997
* Unintended pregnancy among women delivering a live-born infant refers to pregnancies for which a woman either wanted to be pregnant later (mistimed) or did not want to be pregnant at any time (unwanted). Return to top. Figure 6 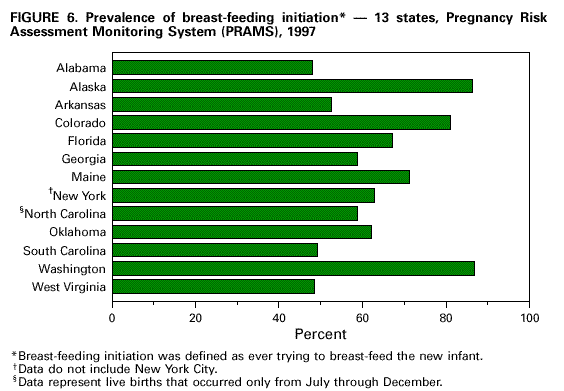 Return to top. Table 7 Note: To print large tables and graphs users may have to change their printer settings to landscape and use a small font size. TABLE 7. Prevalence of entry into prenatal care after the first 3 months of pregnancy or no prenatal care -- 13 states, Pregnancy Risk Assessment Monitoring System (PRAMS), 1997
* For 1997, the range was 16.6%-30.7%. Return to top. Table 8 Note: To print large tables and graphs users may have to change their printer settings to landscape and use a small font size. TABLE 8. Prevalence of entry into prenatal care after the first 3 months of pregnancy or no prenatal care -- 10 states, Pregnancy Risk Assessment Monitoring System (PRAMS), 1993-1997
* P value is statistically significant when p < .05; values of 0.00 represent p < .005. Return to top. Table 9 Note: To print large tables and graphs users may have to change their printer settings to landscape and use a small font size. TABLE 9. Prevalence of entry into prenatal care after the first 3 months of pregnancy or no prenatal care, by selected maternal characteristics -- 13 states, Pregnancy Risk Assessment Monitoring System (PRAMS), 1997
* 95% Confidence interval. Return to top. Table 10 Note: To print large tables and graphs users may have to change their printer settings to landscape and use a small font size. TABLE 10. Prevalence of smoking during the last 3 months of pregnancy -- 13 states, Pregnancy Risk Assessment Monitoring System (PRAMS), 1997
* For 1997, the range was 11.0%-23.9%. Return to top. Table 11 Note: To print large tables and graphs users may have to change their printer settings to landscape and use a small font size. TABLE 11. Prevalence of smoking during the last 3 months of pregnancy -- 10 states, Pregnancy Risk Assessment Monitoring System (PRAMS), 1993-1997
* P value is statistically significant when p < .05; values of 0.00 represent p < .005. Return to top. Table 12 Note: To print large tables and graphs users may have to change their printer settings to landscape and use a small font size. TABLE 12. Prevalence of smoking during the last 3 months of pregnancy, by selected maternal characteristics -- 13 states, Pregnancy Risk Assessment Monitoring System (PRAMS), 1997
* 95% Confidence interval. Return to top. Table 13 Note: To print large tables and graphs users may have to change their printer settings to landscape and use a small font size. TABLE 13. Prevalence of physical abuse during pregnancy by a husband or partner* -- 13 states, Pregnancy Risk Assessment Monitoring System (PRAMS), 1997
* Physical abuse during pregnancy by a husband or partner was defined as being hit, slapped, kicked, or physically hurt in any way. Return to top. Table 14 Note: To print large tables and graphs users may have to change their printer settings to landscape and use a small font size. TABLE 14. Prevalence of physical abuse during pregnancy by a husband or partner* -- 10 states, Pregnancy Risk Assessment Monitoring System (PRAMS), 1996-1997
* Physical abuse during pregnancy by a husband or partner was defined as being hit, slapped, kicked, or physically hurt in any way. Return to top. Table 15 Note: To print large tables and graphs users may have to change their printer settings to landscape and use a small font size. TABLE 15. Prevalence of physical abuse during pregnancy by a husband or partner*, by selected maternal characteristics -- 13 states, Pregnancy Risk Assessment Monitoring System, (PRAMS), 1997
* Physical abuse during pregnancy by a husband or partner was defined as being hit, slapped, kicked, or physically hurt in any way. Return to top. Table 16 Note: To print large tables and graphs users may have to change their printer settings to landscape and use a small font size. TABLE 16. Prevalence of breast-feeding initiation* -- 13 states, Pregnancy Risk Assessment Monitoring System (PRAMS), 1997
* Breast-feeding initiation was defined as ever trying to breast-feed the new infant. Return to top. Table 17 Note: To print large tables and graphs users may have to change their printer settings to landscape and use a small font size. TABLE 17. Prevalence of breast-feeding initiation* -- 10 states, Pregnancy Risk Assessment Monitoring System (PRAMS), 1993-1997
* Breast-feeding initiation was defined as ever trying to breast-feed the new infant. Return to top. Table 18 Note: To print large tables and graphs users may have to change their printer settings to landscape and use a small font size. TABLE 18. Prevalence of breast-feeding initiation*, by selected maternal characteristics -- 13 states, Pregnancy Risk Assessment Monitoring System (PRAMS), 1997
* Breast-feeding initiation was defined as ever trying to breast-feed the new infant. Return to top. Appendix Note: To print large tables and graphs users may have to change their printer settings to landscape and use a small font size. APPENDIX Pregnancy Risk Assessment Monitoring System (PRAMS) States, by stratification, sample size, and response rate, 1997
* Number of women sampled in a state for the year. Return to top. Disclaimer All MMWR HTML versions of articles are electronic conversions from ASCII text into HTML. This conversion may have resulted in character translation or format errors in the HTML version. Users should not rely on this HTML document, but are referred to the electronic PDF version and/or the original MMWR paper copy for the official text, figures, and tables. An original paper copy of this issue can be obtained from the Superintendent of Documents, U.S. Government Printing Office (GPO), Washington, DC 20402-9371; telephone: (202) 512-1800. Contact GPO for current prices. **Questions or messages regarding errors in formatting should be addressed to mmwrq@cdc.gov.Page converted: 9/22/1999 |
|||||||||||||||||||||||||||||||||||||||||||||||||||||||||||||||||||||||||||||||||||||||||||||||||||||||||||||||||||||||||||||||||||||||||||||||||||||||||||||||||||||||||||||||||||||||||||||||||||||||||||||||||||||||||||||||||||||||||||||||||||||||||||||||||||||||||||||||||||||||||||||||||||||||||||||||||||||||||||||||||||||||||||||||||||||||||||||||||||||||||||||||||||||||||||||||||||||||||||||||||||||||||||||||||||||||||||||||||||||||||||||||||||||||||||||||||||||||||||||||||||||||||||||||||||||||||||||||||||||||||||||||||||||||||||||||||||||||||||||||||||||||||||||||||||||||||||||||||||||||||||||||||||||||||||||||||||||||||||||||||||||||||||||||||||||||||||||||||||||||||||||||||||||||||||||||||||||||||||||||||||||||||||||||||||||||||||||||||||||||||||||||||||||||||||||||||||||||||||||||||||||||||||||||||||||||||||||||||||||||||||||||||||||||||||||||||||||||||||||||||||||||||||||||||||||||||||||||||||||||||||||||||||||||||||||||||||||||||||||||||||||||||||||||||||||||||||||||||||||||
This page last reviewed 5/2/01
| |||||||||||||||||||||||||||||||||||||||||||||||||||||||||||||||||||||||||||||||||||||||||||||||||||||||||||||||||||||||||||||||||||||||||||||||||||||||||||||||||||||||||||||||||||||||||||||||||||||||||||||||||||||||||||||||||||||||||||||||||||||||||||||||||||||||||||||||||||||||||||||||||||||||||||||||||||||||||||||||||||||||||||||||||||||||||||||||||||||||||||||||||||||||||||||||||||||||||||||||||||||||||||||||||||||||||||||||||||||||||||||||||||||||||||||||||||||||||||||||||||||||||||||||||||||||||||||||||||||||||||||||||||||||||||||||||||||||||||||||||||||||||||||||||||||||||||||||||||||||||||||||||||||||||||||||||||||||||||||||||||||||||||||||||||||||||||||||||||||||||||||||||||||||||||||||||||||||||||||||||||||||||||||||||||||||||||||||||||||||||||||||||||||||||||||||||||||||||||||||||||||||||||||||||||||||||||||||||||||||||||||||||||||||||||||||||||||||||||||||||||||||||||||||||||||||||||||||||||||||||||||||||||||||||||||||||||||||||||||||||||||||||||||||||||||||||||||||||||||||