
Persons using assistive technology might not be able to fully access information in this file. For assistance, please send e-mail to: mmwrq@cdc.gov. Type 508 Accommodation and the title of the report in the subject line of e-mail.
HIV Infection Among Injection-Drug Users --- 34 States, 2004--2007
Injection-drug users (IDUs) acquire human immunodeficiency virus (HIV) infection by sharing drug equipment with HIV-infected persons and by engaging in risky sexual behavior. In 2007, injection-drug use was the third most frequently reported risk factor for HIV infection in the United States, after male-to-male sexual contact and high-risk heterosexual contact (1). To characterize HIV-infected IDUs aged ≥13 years in the United States, CDC analyzed data from the national notifiable disease reporting system for 2004--2007 from the 34 states that had conducted confidential, name-based HIV surveillance since at least 2003. The results of that analysis indicated that, during 2004--2007, 62.2% of IDUs with a new diagnosis of HIV infection were males, 57.5% were blacks or African Americans, and 74.8% lived in urban areas at the time of their HIV diagnosis. In addition, during 2004--2006, approximately 40% of HIV-infected IDUs received late HIV diagnoses (i.e., diagnosis of acquired immunodeficiency syndrome [AIDS] <12 months after the date of HIV diagnosis). To reduce the prevalence of HIV infection and late HIV diagnosis among IDUs, HIV prevention programs serving IDUs should have comprehensive approaches that incorporate access to HIV testing as part of community-based outreach, drug abuse treatment, and syringe exchange programs.
HIV infection and AIDS are notifiable diseases in all 50 states, the District of Columbia, and five U.S. territories.Although all states have had AIDS reporting since the early 1980s, HIV surveillance with uniform reporting was not implemented in all states until 2008.* CDC regards data from states with confidential, name-based, HIV surveillance systems as sufficient to monitor trends and estimate risk behaviors for HIV infection after 4 continuous years of reporting (1). The HIV and AIDS diagnosis data for IDUs in this report were obtained from case report forms from the 34 states† with such reporting since December 2003.
The data in this report represent IDUs who received a new diagnosis of HIV infection, regardless of when that infection was acquired. Data were adjusted for reporting delays (i.e., the time between diagnosis and report); IDU risk factor information was imputed for persons without sufficient information (1). IDUs who also were categorized as men who have sex with men (MSM) were excluded from the analysis. The number and percentage of IDUs who received HIV diagnoses were estimated by sex, age, race/ethnicity, and area of residence at time of HIV diagnosis. Area of residence was categorized as urban (≥500,000 population), suburban (50,000--499,999), or rural (nonmetropolitan area).
Because no standard national population estimates exist for IDUs, calculation of new HIV diagnosis rates used 2007 general population estimates from the U.S. Census.§ In addition, to identify characteristics associated with late diagnosis of HIV infection, stratified multivariate analyses using log-binomial models were conducted to estimate prevalence ratios by sex and age group in the three racial/ethnic populations with the most HIV-infected IDUs (whites, blacks or African Americans, and Hispanics or Latinos). An HIV diagnosis was considered late if diagnosis of AIDS was received <12 months after the date of HIV diagnosis.
During 2004--2007, a total of 152,917 persons received a diagnosis of HIV infection in the 34 states, including 19,687 (12.9%) IDUs. The majority of HIV-infected IDUs (62.2%) were males (Table 1). By age group, the highest percentage of HIV diagnoses among IDUs (33.2%) was observed among persons aged 35--44 years. By race/ethnicity,¶ blacks or African Americans accounted for 11,321 (57.5%) of HIV-infected IDUs, whites for 4,216 (21.4%), Hispanics or Latinos for 3,764 (19.1%), American Indians or Alaska Natives for 117 (0.6%), Asians for 79 (0.4%), and Native Hawaiians or Other Pacific Islanders for 10 (0.1%). The average annual rate of new HIV infection diagnosis per 100,000 general population during 2004--2007 was 11.0 for black or African American IDUs, 4.9 per 100,000 for Hispanics or Latinos, and 0.9 per 100,000 for whites (Table 1).
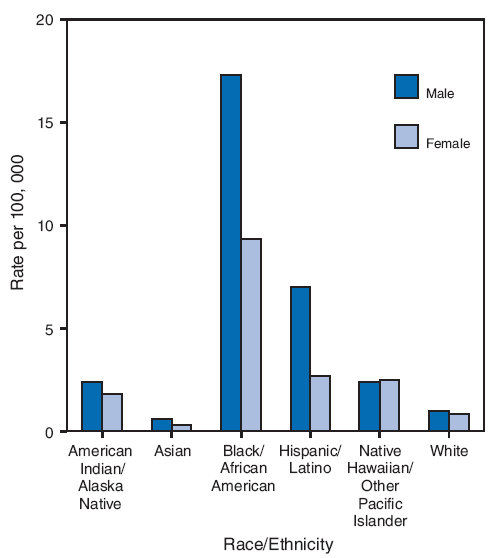
By area of residence, 14,726 (74.8%) IDUs with a new HIV diagnosis lived in urban areas (Table 1). By race/ethnicity and sex, male blacks or African Americans (17.3) had the highest average annual rate of new HIV diagnosis per 100,000 general population during 2004--2007, followed by female black or African Americans (9.3), male Hispanics or Latinos (7.0), and female Hispanics or Latinos (2.7) (Figure).
During 2004--2006, approximately 40% of the estimated 14,715 IDUs with HIV received late diagnoses. In each of the three racial/ethnic populations analyzed (whites, blacks or African Americans, and Hispanics or Latinos), higher percentages of males received a late diagnosis than females (Table 2). Compared with persons aged 13--24 years, higher percentages of persons in older age groups received a late diagnosis of HIV infection (Table 2).
Reported by: A Grigoryan, MD, RL Shouse, MD, T Durant, PhD, TD Mastro, MD, L Espinoza, DDS, M Chen, MS, T Kajese, MSPH, X Wei, MS, HI Hall, PhD, Div of HIV/AIDS Prevention, National Center for HIV/AIDS, Viral Hepatitis, STD, and TB Prevention, CDC.
Editorial Note:
Since the peak of the HIV epidemic among IDUs in the late 1980s, HIV incidence among IDUs has decreased by nearly 80% (2). Despite that overall decline, IDUs continue to represent a substantial proportion of persons with new HIV diagnoses. Recent evidence suggests many IDUs continue to engage in high-risk behaviors such as sharing syringes and having unprotected sex (32% and 63% during the past 12 months, respectively [3]). The higher number of HIV infections among blacks or African Americans is consistent with reports that blacks or African Americans are more likely to inject drugs than whites and have higher rates of HIV infection overall (1,4). HIV prevention programs should be enhanced to target IDUs, especially black or African American IDUs, and to always include HIV testing as a component of the prevention program.
Although a recent analysis indicated that overall testing during the preceding 12 months among IDUs was high (72%) (3), the results in this report indicated that, during 2004--2006, approximately 40% of IDUs received late HIV diagnoses. In another previous analysis, the percentage of late HIV diagnoses among IDUs was found to be significantly higher than among persons in the other major risk behavior categories: MSM (35%), MSM/IDUs (37%) and persons who engage in high-risk heterosexual contact (37%) (CDC, unpublished data, 2009). In addition, IDUs tend to receive HIV diagnoses at older ages than persons who are not IDUs (1), suggesting that IDUs might continue high-risk behaviors at older ages (5) or might be more likely to receive late testing and diagnosis.
In this report, as in previous analyses, late diagnosis of HIV infection was interpreted as a diagnosis that occurred <12 months before a diagnosis of AIDS. An alternative interpretation of that sequence is that some persons have HIV infection that progresses more rapidly to AIDS (6). In addition, more rapid progression to AIDS has been observed among IDUs than among MSM (7). However, other models of rapid HIV progression suggest that the proportion of persons who progress to AIDS <12 months after diagnosis of HIV infection is only 45 in 10,000 patients and thus would have minimal impact on the findings in this analysis (8).
Persons who receive an HIV diagnosis late in the course of their infection receive HIV treatment late and also represent missed opportunities for counseling, education, and substance abuse treatment. To identify all HIV infections as early as possible, including those in IDUs, CDC recommends routine HIV screening in all health-care settings for persons aged 13--64 years and pregnant women and retesting at least annually for all persons at high risk for HIV (9).
The findings in this report are subject to at least four limitations. First, this report only includes data from 34 states with confidential, name-based HIV reporting since 2003. Although HIV is now a reportable condition in all 50 states, name-based HIV reporting was not implemented in all 50 states until 2008. The 34 states with data analyzed in this report are estimated to represent 66% of all AIDS cases in the United States (1). Certain areas with historically high AIDS morbidity that have not conducted confidential, name-based HIV surveillance since 2003 (e.g., California, Illinois, and the District of Columbia) were not included, thus the results might not be nationally representative. Second, diagnoses of HIV infection might not always represent new infections. CDC has established a new system for measuring incident HIV infection at the population level, providing a tool to assess HIV infection among IDUs apart from HIV diagnoses alone (2). However, diagnosis data continue to be an important indicator for monitoring HIV disparities and potentially adverse outcomes (e.g., late diagnosis). Third, misclassification of the HIV diagnosis date might have occurred in certain cases. For example, some persons might have had positive results from anonymous, unreported HIV tests before they had a confidential HIV test that was reported to a health department, making the time from initial HIV diagnosis to AIDS diagnosis appear shorter than was actually the case. Finally, this analysis did not consider the frequency of HIV testing or screening among IDUs. Variations in screening rates might lead to higher or lower rates of HIV diagnosis.
The overall declines in new HIV infections among IDUs since the 1980s likely are related to decreases in injection-drug use or the sharing of injection equipment and changes in social networks of IDUs (e.g., associating with persons who do not have HIV infection or who are less likely to share injecting equipment) (9). However, many IDUs with newly diagnosed infection have suboptimal access to and utilization of highly active antiretroviral therapy (HAART), and initiate HAART at more advanced stages of infection (10). Programs to prevent HIV among IDUs should address both risk from injecting and risk from unsafe sexual behavior. HIV testing should be a key component of any comprehensive strategy, and new opportunities to test IDUs (e.g., in correctional facilities or mental health clinics) should be considered. In addition, newer testing technologies such as rapid HIV testing might enable programs to reach IDUs who would otherwise not be tested.
References
- CDC. HIV/AIDS surveillance report, 2007. Vol. 19. Atlanta, GA: US Department of Health and Human Services, CDC; 2009. Available at http://www.cdc.gov/hiv/topics/surveillance/resources/reports. Accessed November 24, 2009.
- Hall HI, Song R, Rhodes P, et al; HIV Incidence Surveillance Group. Estimation of HIV incidence in the United States. JAMA 2008;300:520--9.
- CDC. HIV-associated behaviors among injecting-drug users---23 cities, United States, May 2005--February 2006. MMWR 2009;58:329--32.
- Santibanez SS, Garfein RS, Swartzendruber A, Purcell DW, Paxton LA, Greenberg AE. Update and overview of practical epidemiologic aspects of HIV/AIDS among injection drug users in the United States. J Urban Health 2006;83:86--100.
- Kwiatkowski CF, Booth RE. HIV risk behaviors among older American drug users. J Acquir Immune Defic Syndr 2003;33:S131--7.
- CDC. Investigation of a new diagnosis of multidrug-resistant, dual-tropic HIV-1 infection ---New York City, 2005. MMWR 2006;55:793--6.
- El-Sadr W, Paik M, Gorman J, Stein Z. Increased morbidity and more rapid progression in HIV-infected injection drug users. Proceedings of the International Conference on AIDS. June 6--11, 1993; Berlin, Germany.
- Gange S, Munoz A. Variations in the natural history of HIV seroconverters in US military cohorts. Proceedings of the 12th Conference on Retroviruses and Opportunistic Infections. February 22--25, 2005; Boston, MA.
- CDC. Revised recommendations for HIV testing of adults, adolescents, and pregnant women in health-care settings. MMWR 2006;55(No. RR-14).
- Celentano DD, Galai N, Sethi AK, et al. Time to initiating highly active antiretroviral therapy among HIV-infected injection drug users. AIDS 2001;15:1707--15.
* Case definitions and additional information regarding HIV reporting available at http://www.cdc.gov/hiv/topics/surveillance/resources/reports/2007report/technicalnotes.htm.
† Alabama, Alaska, Arizona, Arkansas, Colorado, Florida, Georgia, Idaho, Indiana, Iowa, Kansas, Louisiana, Michigan, Minnesota, Mississippi, Missouri, Nebraska, Nevada, New Jersey, New Mexico, New York, North Carolina, North Dakota, Ohio, Oklahoma, South Carolina, South Dakota, Tennessee, Texas, Utah, Virginia, West Virginia, Wisconsin, and Wyoming.
§ Available at http://www.census.gov/popest/archives/2000s/vintage_2007.
¶ For this report, persons identified as white, black or African American, Asian, Native Hawaiian or other Pacific Islander, American Indian or Alaska Native, or of other or unknown race are non-Hispanic. Persons identified as Hispanic or Latino might be of any race.
|
What is already known on this topic? In 2007, injection-drug use was the third most frequently reported risk factor among persons with diagnosed human immunodeficiency virus (HIV) infection in the United States after male-to-male sexual contact and high-risk heterosexual contact. What is added by this report? During 2004--2007, 62% of injection-drug users (IDUs) with diagnosed HIV infection were males, 58% were blacks or African Americans, and 75% lived in urban areas at the time of their HIV diagnosis; during 2004--2006, approximately 40% of IDUs with diagnosed HIV infection were deemed to be diagnosed with HIV late in the course of their infection. What are the implications for public health practice? HIV prevention programs should be enhanced to target IDUs, especially black or African American IDUs, to address both risk from injecting and from risky sexual behavior, to seek new opportunities for testing IDUs (e.g., in correctional facilities or mental health clinics), and to include HIV testing consistently as a component of the prevention program. |
|
TABLE 1. Estimated number,* percentage, and average annual rate† of new diagnoses of human immunodeficiency virus (HIV) infection,§ among injection-drug users (IDUs),¶ by selected characteristics --- 34 states,** 2004--2007 |
|||
|---|---|---|---|
|
Characteristic |
No. |
(%)†† |
Rate |
|
Sex |
|||
|
Male |
12,253 |
(62.2) |
3.9 |
|
Female |
7,434 |
(37.8) |
2.2 |
|
Age group (yrs) |
|||
|
13--24 |
1,453 |
(7.4) |
1.1 |
|
25--34 |
3,758 |
(19.1) |
3.5 |
|
35--44 |
6,538 |
(33.2) |
5.7 |
|
45--54 |
5,621 |
(28.6) |
5.0 |
|
55--64 |
1,831 |
(9.3) |
2.2 |
|
≥65 |
486 |
(2.5) |
0.5 |
|
Race/Ethnicity |
|||
|
American Indian/Alaska Native |
117 |
(0.6) |
2.1 |
|
Asian |
79 |
0.4) |
0.4 |
|
Black/African American |
11,321 |
(57.5) |
11.0 |
|
Hispanic/Latino |
3,764 |
(19.1) |
4.9 |
|
Native Hawaiian/Other Pacific Islander |
10 |
(0.1) |
2.4 |
|
White |
4,216 |
(21.4) |
0.9 |
|
Multiple |
180 |
(0.9) |
--- |
|
Area of residence§§ |
|||
|
Urban |
14,726 |
(74.8) |
3.7 |
|
Suburban |
2,683 |
(13.6) |
2.1 |
|
Rural |
2,125 |
(10.8) |
1.7 |
|
Unknown |
153 |
(0.8) |
--- |
|
Total |
19,687 |
(100) |
3.0 |
|
* N = 19,687. Includes persons who received a diagnosis of HIV infection with or without acquired immunodeficiency syndrome. Data as of June 2008, adjusted for reporting delays and missing IDU risk factor information. † Per 100,000 general population with each characteristic. § Case definitions and additional information regarding HIV reporting available at http://www.cdc.gov/hiv/topics/surveillance/resources/reports/2007report/technicalnotes.htm. ¶ Excludes persons categorized as IDUs/men who have sex with men. ** Data were reported by 34 states with confidential, name-based reporting since at least December 2003: Alabama, Alaska, Arizona, Arkansas, Colorado, Florida, Georgia, Idaho, Indiana, Iowa, Kansas, Louisiana, Michigan, Minnesota, Mississippi, Missouri, Nebraska, Nevada, New Jersey, New Mexico, New York, North Carolina, North Dakota, Ohio, Oklahoma, South Carolina, South Dakota, Tennessee, Texas, Utah, Virginia, West Virginia, Wisconsin, and Wyoming. †† Percentages might not add to 100% because of rounding. §§ Urban: ≥500,000 population. Suburban: 50,000--499,999. Rural: nonmetropolitan area. |
|||
FIGURE. Estimated average annual rate* of new diagnoses of human immunodeficiency virus (HIV) infection† among injection-drug users (IDUs),§ by race/ethnicity and sex --- 34 states,¶ 2004--2007**
* Per 100,000 general population.
† Case definitions and additional information regarding HIV reporting available at http://www.cdc.gov/hiv/topics/surveillance/resources/reports/2007report/technicalnotes.htm.
§ Excludes persons categorized as IDUs/men who have sex with men.
¶ Data were reported by 34 states with confidential, name-based reporting since at least December 2003: Alabama, Alaska, Arizona, Arkansas, Colorado, Florida, Georgia, Idaho, Indiana, Iowa, Kansas, Louisiana, Michigan, Minnesota, Mississippi, Missouri, Nebraska, Nevada, New Jersey, New Mexico, New York, North Carolina, North Dakota, Ohio, Oklahoma, South Carolina, South Dakota, Tennessee, Texas, Utah, Virginia, West Virginia, Wisconsin, and Wyoming.
** Includes persons (N = 19,507) who received a diagnosis of HIV infection with or without acquired immunodeficiency syndrome. Data as of June 2008, adjusted for reporting delays and missing IDU risk factor information.
Alternate Text: The figure above is a bar chart showing the estimated average annual rate per 100,000 general population of new diagnoses of human immunodeficiency virus (HIV) infection among injection-drug users (IDUs), by race/ethnicity and sex in 34 states during 2004 to 2007. Male blacks or African Americans had the highest average annual rate of new HIV diagnosis, 17.3, followed by female black or African Americans, 9.3, male Hispanics or Latinos, 7.0, and female Hispanics or Latinos, 2.7.
|
TABLE 2. Estimated number* and percentage of late diagnoses† of human immunodeficiency virus (HIV) infection§ among white, black/African American and Hispanic/Latino injection-drug users,¶ by sex and age group --- 34 states,** 2004--2006 |
||||||||||||
|---|---|---|---|---|---|---|---|---|---|---|---|---|
|
Sex/Age group |
White |
Black/African American |
Hispanic/Latino |
|||||||||
|
No. IDUs with late HIV diagnosis |
(% IDUs with late HIV diagnosis††) |
APR§§ |
(95% CI¶¶) |
No. IDUs with late HIV diagnosis |
(% IDUs with late HIV diagnosis) |
APR |
(95% CI) |
No. IDUs with late HIV diagnosis |
(% IDUs with late HIV diagnosis) |
APR |
(95% CI) |
|
|
Sex |
|
|
|
|
|
|
|
|
|
|
|
|
|
Female |
459 |
(31.7) |
Referent |
--- |
1,248 |
(37.9) |
Referent |
--- |
290 |
(38.6) |
Referent |
--- |
|
Male |
731 |
(43.2) |
1.2 |
(1.1--1.3) |
2,208 |
(42.4) |
1.1 |
(1.0--1.1) |
931 |
(45.8) |
1.1 |
(1.0--1.3) |
|
Age group (yrs) |
|
|
|
|
|
|
|
|
|
|
|
|
|
13--24 |
31 |
(12.5) |
Referent |
--- |
123 |
(19.9) |
Referent |
--- |
57 |
(27.8) |
Referent |
--- |
|
25--34 |
171 |
(26.1) |
2.0 |
(1.4--2.9) |
458 |
(33.0) |
1.7 |
(1.4--2.0) |
267 |
(39.3) |
1.4 |
(1.1--1.8) |
|
35--44 |
454 |
(39.0) |
3.0 |
(2.1--4.2) |
1,133 |
(41.0) |
2.0 |
(1.7--2.4) |
433 |
(44.4) |
1.6 |
(1.2--2.0) |
|
45--54 |
386 |
(47.6) |
3.6 |
(2.5--5.0) |
1,182 |
(45.0) |
2.2 |
(1.9--2.6) |
313 |
(49.0) |
1.7 |
(1.4--2.2) |
|
55--64 |
119 |
(56.8) |
4.2 |
(2.9--6.0) |
431 |
(48.6) |
2.4 |
(2.0--2.9) |
107 |
(50.3) |
1.8 |
(1.4--2.3) |
|
≥65 |
29 |
(55.1) |
4.1 |
(2.7--6.2) |
128 |
(60.3) |
3.0 |
(2.5--3.6) |
44 |
(61.9) |
2.2 |
(1.6--2.9) |
|
Total |
1,190 |
(37.9) |
--- |
--- |
3,456 |
(40.7) |
--- |
--- |
1,221 |
(43.9) |
--- |
--- |
|
* N = 5,867. Includes persons who received a diagnosis of HIV infection with or without acquired immunodeficiency syndrome. Data as of June 2008, adjusted for reporting delays and missing IDU risk factor information. † An HIV diagnosis was considered late if diagnosis of acquired immunodeficiency syndrome was received <12 months after the date of HIV diagnosis. § Case definitions and additional information regarding HIV reporting available at http://www.cdc.gov/hiv/topics/surveillance/resources/reports/2007report/technicalnotes.htm. ¶ Excludes persons categorized as IDUs/men who have sex with men. ** Data were reported by 34 states with confidential, name-based reporting: Alabama, Alaska, Arizona, Arkansas, Colorado, Florida, Georgia, Idaho, Indiana, Iowa, Kansas, Louisiana, Michigan, Minnesota, Mississippi, Missouri, Nebraska, Nevada, New Jersey, New Mexico, New York, North Carolina, North Dakota, Ohio, Oklahoma, South Carolina, South Dakota, Tennessee, Texas, Utah, Virginia, West Virginia, Wisconsin, and Wyoming. †† Calculated by dividing the number of IDUs with late HIV diagnoses by the total number of IDUs with new HIV diagnoses for each sex/age group. §§ Adjusted prevalence ratio (i.e., adjusted for sex or age group). ¶¶ Confidence interval. |
||||||||||||
Use of trade names and commercial sources is for identification only and does not imply endorsement by the U.S. Department of
Health and Human Services. |
All MMWR HTML versions of articles are electronic conversions from typeset documents. This conversion might result in character translation or format errors in the HTML version. Users are referred to the electronic PDF version (http://www.cdc.gov/mmwr) and/or the original MMWR paper copy for printable versions of official text, figures, and tables. An original paper copy of this issue can be obtained from the Superintendent of Documents, U.S. Government Printing Office (GPO), Washington, DC 20402-9371; telephone: (202) 512-1800. Contact GPO for current prices.
**Questions or messages regarding errors in formatting should be addressed to mmwrq@cdc.gov.Date last reviewed: 11/25/2009