
Persons using assistive technology might not be able to fully access information in this file. For assistance, please send e-mail to: mmwrq@cdc.gov. Type 508 Accommodation and the title of the report in the subject line of e-mail.
Hepatitis A Vaccination Coverage Among Children Aged 24--35 Months --- United States, 2006 and 2007
During 1995--1996, hepatitis A vaccines were licensed in the United States as 2-dose regimens for children aged ≥24 months. In 1996, the Advisory Committee on Immunization Practices (ACIP) recommended vaccinating children aged ≥24 months who lived in communities or states with high rates of hepatitis A (1). In 1999, ACIP updated its guidelines, recommending routine vaccination for children aged ≥24 months in areas with hepatitis A rates twice the national average, and recommending consideration of routine vaccination in areas with rates higher than the national average (2). However, in 2005, this regional vaccination strategy was reevaluated because national hepatitis A rates had decreased to such an extent that differences among states were no longer substantial (3). Additionally, in 2005, hepatitis A vaccine was licensed for children aged 12--23 months. As a result of these developments, in 2006, ACIP expanded its hepatitis A vaccination recommendation to all children in the United States and reduced the recommended age for vaccination to 12--23 months (4). This report updates previous findings regarding hepatitis A vaccination coverage, providing estimates based on National Immunization Survey (NIS) data for 2006 and 2007. From 2006 to 2007, estimated national hepatitis A vaccination coverage levels among children aged 24--35 months who received at least 1 dose increased from 26.3% to 47.4%. The increase in hepatitis A vaccination coverage likely is the result of the expanded 2006 ACIP recommendations; adherence to these recommendations should lead to further declines in hepatitis A incidence in the United States.
NIS is an ongoing, random-digit--dialed survey of households with children aged 19--35 months at the time of interview, followed by a mail survey of each child's vaccination provider to obtain vaccination data (5). Data from NIS are used to produce timely estimates of vaccination coverage rates for all childhood vaccinations recommended by ACIP.* Data are weighted to adjust for households with multiple telephone lines, household nonresponse, and exclusion of households without landline telephones. The 2006 NIS interviews were conducted during January 2006--February 2007 and included children who were born during January 2003--July 2005. The 2007 NIS interviews were conducted during January 2007--February 2008 and included children who were born during January 2004--July 2006. In 2006, the survey was conducted in all 50 states and 30 local areas.† In 2007, the number of local areas was reduced to 14.§ The NIS household survey response rate was 64.5% in 2006 and 64.9% in 2007.
Among children aged 19--35 months for whom NIS household interviews were completed, health-care provider vaccination records were obtained for 21,044 children (70.4%) in 2006 and 17,017 children (68.6%) in 2007. Among the children with vaccination records, 14,804 children in 2006 and 12,018 in 2007 met the age criteria of 24--35 months for this study. Although hepatitis A vaccine is licensed as a 2-dose regimen (with the second dose recommended 6--18 months after the initial dose), this analysis was of vaccination coverage among children who had received at least 1 dose of vaccine. Tests for differences in 2006 and 2007 coverage estimates were conducted using t-tests with significant differences at p<0.05.
Nationally, among children aged 24--35 months, estimated hepatitis A vaccination coverage with at least 1 dose increased from 26.3% in 2006 to 47.4% in 2007 (Table). By ACIP vaccination recommendation status, the largest increase in vaccination coverage, from 7.2% to 32.7%, was observed in the 33 states¶ (and the District of Columbia [DC]) that had not been recommended for vaccination before 2006. Vaccination coverage also increased (from 62.8% to 74.1%) in the 11 states where vaccination had been recommended since 1999 and in the six states where vaccination had been recommended for consideration since 1999 for children aged ≥24 months (from 48.8% to 66.6%).
By individual state, substantial variability in estimated vaccination coverage was observed. Among the 33 states (and DC) first recommended for hepatitis A vaccination in 2006, coverage in 2006 ranged from 0.4% (Maine) to 17.7% (Tennessee), and coverage in 2007 ranged from 11.6% (Maine) to 60.1% (Rhode Island). Among the 11 states where vaccination had been recommended since 1999, coverage in 2006 ranged from 7.4% (South Dakota) to 73.7% (Oklahoma), and coverage in 2007 ranged from 31.6% (South Dakota) to 82.8% (Alaska). Among the six states where vaccination had been recommended for consideration since 1999, coverage in 2006 ranged from 3.6% (Arkansas) to 62.5% (Texas), and coverage in 2007 ranged from 11.7% (Arkansas) to 77.5% (Texas).
In 2006, children who were American Indian/Alaska Native (AI/AN) (64.0%) or Hispanic (63.0%) had significantly higher estimates of hepatitis A vaccination coverage than non-Hispanic whites (50.3%). In 2007, children who were AI/AN (86.2%), Hispanic (78.9%), or Asian (75.1%) had significantly higher coverage than non-Hispanic whites (62.4%) (Figure 1). No other significant differences were found in the pairwise comparisons of race/ethnicity for either year.
After the 2006 ACIP recommendations lowered the minimum age for hepatitis A vaccination from ≥24 months to 12--23 months, approximately half of children in the 2007 NIS received their first dose at age <24 months in states where routine vaccination had been recommended or recommended for consideration since 1999 (Figure 2). Among states where vaccination was not recommended until 2006, approximately two thirds received their first dose at age <24 months.
Reported by: SS Chaves, MD, Div of Viral Hepatitis, National Center for HIV/AIDS, Viral Hepatitis, STD, and TB Prevention; N Darling, MPH, T Santibanez, PhD, Immunization Services Div, National Center for Immunization and Respiratory Diseases, CDC.
Editorial Note:
The estimated 21.1% increase in hepatitis A vaccination coverage observed in 2007 overall in the United States, and particularly among those 33 states where no previous recommendation was in effect, likely resulted in large part from the 2006 ACIP recommendations that expanded use of hepatitis A vaccine to children nationwide and reduced the recommended age for vaccination from ≥24 months to 12--23 months. The percentage of children in compliance with the well-child visit recommendations of the American Academy of Pediatrics has been found substantially higher among infants and children aged <24 months, when well-child visits are more frequent, than children aged ≥24 months, when such visits occur annually (6). Therefore, incorporation of hepatitis A vaccine into the routine early childhood vaccination schedule was an important strategy to improve vaccination coverage after the 2006 ACIP recommendation.
Compared with the prevaccination era, the number of cases and rates of acute hepatitis A in the United States have declined substantially (7). Historically, hepatitis A rates have differed by race/ethnicity. In the prevaccination era, rates of acute hepatitis A were five times greater among AI/ANs and three times greater among Hispanics than the national average (7--9). However, after several years of focused efforts to increase hepatitis A vaccination in AI/AN communities, during 2001--2007, hepatitis A rates among AI/ANs were lower than rates among persons in other racial/ethnic populations. In 2007, the hepatitis A rate was 0.5 cases per 100,000 population among AI/ANs and 1.4 cases per 100,000 population among Hispanics (a decline of 94% since 1997) (7). In this report, the significantly higher percentages in 2006 and 2007 of hepatitis A vaccination coverage among AI/AN and Hispanic children compared with non-Hispanic white children likely reflect earlier emphasis on these minority populations in areas with elevated rates of hepatitis A and exemplify the substantial progress made toward eliminating racial/ethnic disparities.
The findings in this report are subject to at least three limitations. First, NIS is a landline telephone survey; although statistical adjustments compensate for nonresponse and households without telephones, some bias might remain. Second, NIS relies on provider-verified vaccination histories; incomplete records and reporting might result in biased estimates. Finally, estimates for certain state and local areas with small sample sizes and wide confidence intervals should be interpreted with caution.
Studies have found that 97%--100% of children aged 2--18 years had protective levels of antibody 1 month after receiving their first dose of hepatitis A vaccine and 100% had protective levels 1 month after receiving their second dose (4). Although current studies show long-term protection more than a decade after vaccination, the second dose might be more important for lasting vaccine-induced immunity as younger children aged 12--23 months are vaccinated. Thus, for hepatitis A vaccination to be effective, the vaccine must confer long-term protection.
Continued surveillance and monitoring is critical because the hypothetical possibility of waning immunity might lead to the higher probability of symptomatic infections during adolescence and adulthood (4). Despite the increase in hepatitis A vaccination coverage with at least 1 dose observed in 2007, the impact of the 2006 ACIP recommendation cannot yet be fully assessed. Based on 2007 NIS data, national estimated vaccination coverage with at least 2 doses of hepatitis A vaccine was 36.7% for children who were aged <12 months on May 19, 2006, when the new ACIP recommendations were published (CDC, unpublished data, 2009). Measurement of vaccination coverage with at least 2 doses of hepatitis A vaccine among children aged 19--35 months is important to assess the effect of hepatitis A immunization on the control and potential elimination of hepatitis A in the United States.
References
- CDC. Prevention of hepatitis A through active or passive immunization: recommendations of the Advisory Committee on Immunization Practices (ACIP). MMWR 1996;45(No. RR-15).
- CDC. Prevention of hepatitis A through active or passive immunization: recommendations of the Advisory Committee on Immunization Practices (ACIP). MMWR 1999;48(No. RR-12).
- CDC. Surveillance for acute viral hepatitis---United States, 2006. MMWR 2008;57(No. SS-2).
- CDC. Prevention of hepatitis A through active or passive immunization: recommendations of the Advisory Committee on Immunization Practices (ACIP). MMWR 2006;55(No. RR-7).
- Smith PJ, Hoaglin DC, Battaglia MP, Khare M, Barker LE. Statistical methodology of the National Immunization Survey, 1994--2002. Vital Health Stat 2 2005(138).
- Selden TM. Compliance with well-child visit recommendations: evidence from the Medical Expenditure Panel Survey, 2000--2002. Pediatrics 2006;118:e1766--78.
- CDC. Surveillance for acute viral hepatitis---United States, 2007. MMWR 2009;58(No. SS-3).
- Bialek SR, Thoroughman DA, Hu D, et al. Hepatitis A incidence and hepatitis A vaccination among American Indians and Alaska Natives, 1990--2001. Am J Public Health 2004;94:996--1001.
- Bulkow LR, Wainwright RB, McMahon BJ, Middaugh JP, Jenkerson SA, Margolis HS. Secular trends in hepatitis A virus infection among Alaska Natives. J Infect Dis 1993;168:1017--20.
* Additional information available at http://www.cdc.gov/nis.
† The 30 local areas sampled separately for the 2006 NIS included six areas that receive federal immunization grant funds and have been included in the NIS every year since its inception in 1994 (District of Columbia; Chicago, Illinois; New York, New York; Philadelphia County, Pennsylvania; Bexar County, Texas; and Houston, Texas). Also included were 18 areas that had been included each year during 1994--2004 (Maricopa County, Arizona; Los Angeles County, California; San Diego County, California; Santa Clara County, California; Duval County, Florida; Miami-Dade County, Florida; Fulton and DeKalb counties, Georgia; Marion County, Indiana; Baltimore, Maryland; Boston, Massachusetts; Detroit, Michigan; Newark, New Jersey; Cuyahoga County, Ohio; Shelby County, Tennessee; Dallas County, Texas; El Paso County, Texas; King County, Washington; and Milwaukee County, Wisconsin). Also included were six areas sampled for the first time (northern California counties; Fresno County, California; eastern Kansas counties; southern New Mexico counties; Allegheny County, Pennsylvania; and eastern Washington counties).
§ Fourteen local areas were sampled separately for the 2007 NIS. These included the six areas that receive federal immunization grant funds and have been included in the NIS sample every year since its inception in 1994. Also included were seven previously sampled areas (Alameda County, California; Los Angeles County, California; San Bernardino County, California; Miami-Dade County, Florida; Marion County, Indiana; Dallas County, Texas; and El Paso County, Texas) and one area sampled for the first time (western Washington). Local areas sampled by NIS might change yearly as state immunization programs conduct local assessments where they are most needed.
¶ The 17 other states included 11 where routine hepatitis A vaccination had been recommended since 1999 (Alaska, Arizona, California, Idaho, Nevada, New Mexico, Oklahoma, Oregon, South Dakota, Utah, and Washington) and six states where routine vaccination had been recommended for consideration include (Arkansas, Colorado, Missouri, Montana, Texas, and Wyoming).
|
TABLE. (Continued) Estimated hepatitis A vaccination coverage (at least 1 dose) among children aged 24--35 months,* by ACIP vaccination recommendation status† and state/local area --- National Immunization Survey (NIS), United States, 2006 and 2007 |
|||||
|---|---|---|---|---|---|
|
State/Local area |
2006§ |
2007¶ |
% point difference from 2006 to 2007 |
||
|
% |
(95% CI**) |
% |
(95% CI) |
||
|
City of Chicago |
30.7 |
(23.7--38.7) |
47.2 |
(38.4--56.3) |
16.5†† |
|
Rest of state |
5.5 |
(2.8--10.4) |
33.7 |
(26.4--41.8) |
28.2†† |
|
Indiana |
6.1 |
(3.5--10.3) |
31.8 |
(25.5--38.9) |
25.7†† |
|
Marion County |
12.0 |
(6.8--20.3) |
27.7 |
(21.6--34.8) |
15.7†† |
|
Rest of state |
4.9 |
(2.3--10.1) |
32.6 |
(25.2--41.1) |
27.7†† |
|
Iowa |
7.2 |
(4.1--12.3) |
25.5 |
(19.4--32.7) |
18.3†† |
|
Kansas |
14.1 |
(10.5--18.6) |
34.3 |
(26.6--43.0) |
20.2†† |
|
Eastern Kansas |
28.6 |
(21.8--36.5) |
--- |
--- |
--- |
|
Rest of state |
8.9 |
(5.1--14.9) |
--- |
--- |
--- |
|
Kentucky |
3.2 |
(1.3--7.6) |
27.8 |
(21.3--35.3) |
24.6†† |
|
Louisiana |
4.9 |
(2.5--9.5) |
38.4 |
(30.0--47.5) |
33.5†† |
|
Maine |
0.4 |
(0.1--3.1) |
11.6 |
(6.5--19.9) |
11.2†† |
|
Maryland |
13.9 |
(9.9--19.2) |
49.6 |
(39.8--59.4) |
35.7†† |
|
City of Baltimore |
42.7 |
(34.2--51.6) |
--- |
--- |
--- |
|
Rest of state |
9.8 |
(5.8--16.2) |
--- |
--- |
--- |
|
Massachusetts |
3.3 |
(1.5--6.9) |
20.0 |
(12.0--31.5) |
16.7†† |
|
City of Boston |
4.5 |
(2.3--8.7) |
--- |
--- |
--- |
|
Rest of state |
3.1 |
(1.3--7.3) |
--- |
--- |
--- |
|
Michigan |
1.8 |
(0.7--4.5) |
29.8 |
(22.2--38.6) |
28.0†† |
|
City of Detroit |
4.2 |
(2.1--8.4) |
--- |
--- |
--- |
|
Rest of state |
1.5 |
(0.4--5.0) |
--- |
--- |
--- |
|
Minnesota |
3.1 |
(1.3--7.3) |
23.2 |
(17.0--30.7) |
20.1†† |
|
Mississippi |
1.7 |
(0.5--5.5) |
21.6 |
(14.8--30.4) |
19.9†† |
|
Nebraska |
8.9 |
(5.6--13.9) |
38.5 |
(29.9--47.9) |
29.6†† |
|
New Hampshire |
1.2 |
(0.3--5.0) |
22.2 |
(15.3--31.1) |
21.0†† |
|
New Jersey |
9.7 |
(5.7--15.9) |
40.9 |
(32.5--49.9) |
31.2†† |
|
City of Newark |
3.6 |
(1.8--7.0) |
--- |
--- |
--- |
|
Rest of state |
9.9 |
(5.8--16.4) |
--- |
--- |
--- |
|
New York |
11.7 |
(8.6--15.6) |
31.6 |
(26.3--37.4) |
19.9†† |
|
City of New York |
16.1 |
(11.6--22.1) |
34.6 |
(27.8--42.1) |
18.5†† |
|
Rest of state |
7.5 |
(3.9--13.7) |
28.8 |
(21.1--38.0) |
21.3†† |
|
North Carolina |
3.3 |
(1.3--7.7) |
31.9 |
(23.8--41.2) |
28.6†† |
|
North Dakota |
10.5 |
(5.6--19.0) |
47.1 |
(39.0--55.3) |
36.6†† |
|
Ohio |
3.6 |
(1.9--6.7) |
23.5 |
(17.9--30.2) |
19.9†† |
|
Cuyahoga County |
3.1 |
(1.3--7.2) |
--- |
--- |
--- |
|
Rest of state |
3.7 |
(1.8--7.3) |
--- |
--- |
--- |
|
Pennsylvania |
3.8 |
(2.3--6.1) |
41.0 |
(35.1--47.1) |
37.2†† |
|
Allegheny County |
6.8 |
(3.2--13.7) |
--- |
--- |
--- |
|
Philadelphia County |
6.0 |
(3.0--11.8) |
49.6 |
(40.2--58.9) |
43.6†† |
|
Rest of state |
2.9 |
(1.4--6.1) |
39.4 |
(32.8--46.5) |
36.5†† |
|
Rhode Island |
13.0 |
(8.9--18.6) |
60.1 |
(49.8--69.6) |
47.1†† |
|
South Carolina |
2.4 |
(1.1--5.1) |
29.4 |
(23.4--36.2) |
27.0†† |
|
Tennessee |
17.7 |
(11.9--25.3) |
48.2 |
(39.4--57.1) |
30.5†† |
|
Shelby County |
27.0 |
(19.6--36.0) |
--- |
--- |
--- |
|
Rest of state |
15.6 |
(9.1--25.3) |
--- |
--- |
--- |
|
Vermont |
1.3 |
(0.3--5.3) |
23.1 |
(15.3--33.2) |
21.8†† |
|
Virginia |
8.6 |
(5.1--14.2) |
34.5 |
(27.5--42.2) |
25.9†† |
|
West Virginia |
2.5 |
(1.0--5.9) |
23.9 |
(18.0--31.1) |
21.4†† |
|
Wisconsin |
11.1 |
(8.2--15.0) |
34.6 |
(26.6--43.5) |
23.5†† |
|
Milwaukee County |
33.2 |
(24.8--42.8) |
--- |
--- |
--- |
|
Rest of state |
5.2 |
(2.7--9.6) |
--- |
--- |
--- |
|
* 2006: n = 14,804; 2007: n = 12,018. † CDC. Prevention of hepatitis A through active or passive immunization: recommendations of the Advisory Committee on Immunization Practices (ACIP). MMWR 1999;48(No. RR-12). CDC. Prevention of hepatitis A through active or passive immunization: recommendations of the Advisory Committee on Immunization Practices (ACIP). MMWR 2006;55(No. RR-7). § Among children born during January 2003--March 2005. ¶ Among children born during January 2004--March 2006. ** Confidence interval. †† Difference is statistically significant (p<0.05). §§ Area was not sampled. Local areas sampled by NIS might change yearly as state immunization programs conduct local assessments where they are most needed. ¶¶ Estimate not reported because it is unstable; 95% CI >20 percentage points. |
|||||
FIGURE 1. Estimated hepatitis A vaccination coverage (at least 1 dose) among children aged 24--35 months* in states and local areas where routine vaccination has been recommended or recommended for consideration by ACIP since 1999,† by race/ethnicity --- National Immunization Survey, United States, 2006 and 2007
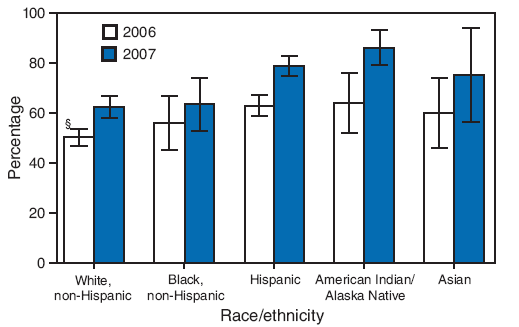
* 2006: n = 14,804; 2007: n = 12,018.
† CDC. Prevention of hepatitis A through active or passive immunization: recommendations of the Advisory Committee on Immunization Practices (ACIP). MMWR 1999;48(No. RR-12).
§ 95% confidence interval.
Alternative Text: The figure above shows estimated hepatitis A vaccination coverage (at least 1 dose) among children aged 24-35 months in U.S. states and local areas where routine vaccination has been recommended or recommended for consideration by the Advisory Committee on Immunization Practices (ACIP) since 1999, by race/ethnicity . The data are derived from National Immunization Surveys for 2006 and 2007. According to the figure, in 2006, children who were American Indian/Alaska Native (AI/AN) (64.0%) or Hispanic (63.0%) had significantly higher hepatitis A vaccination coverage than non-Hispanic whites (50.3%). In 2007, children who were AI/AN (86.2%), Hispanic (78.9%), or Asian (75.1%) had significantly higher coverage than non-Hispanic whites (62.4%).
FIGURE 2. Estimated hepatitis A vaccination coverage (at least 1 dose) among children aged 24--35 months,* by age at first vaccine dose and by state's ACIP vaccination recommendation status† --- National Immunization Survey, United States, 2006 and 2007
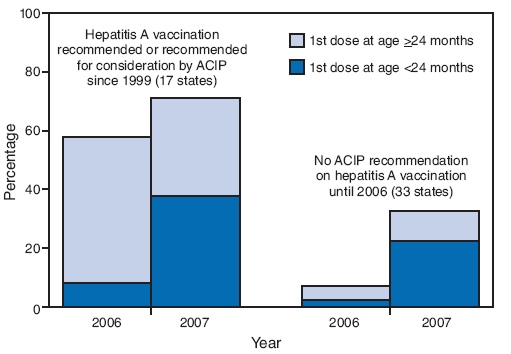
* 2006: n = 14,804; 2007: n = 12,018.
† CDC. Prevention of hepatitis A through active or passive immunization: recommendations of the Advisory Committee on Immunization Practices (ACIP). MMWR 1999;48(No. RR-12). CDC. Prevention of hepatitis A through active or passive immunization: recommendations of the Advisory Committee on Immunization Practices (ACIP). MMWR 2006;55(No. RR-7).
Alternative Text: The figure above shows estimated hepatitis A vaccination coverage (at least 1 dose) among children aged 24-35 months, by age at first vaccine dose and by state's vaccination recommendation status. The data are derived from National Immunization Surveys for 2006 and 2007. According to the figure, after 2006 Advisory Committee on Immunization Practices recommendations lowered the minimum age for hepatitis A vaccination from >24 months to 12-23 months, approximately half of children in the 2007 NIS received their first dose at age <24 months in states where routine vaccination had been recommended or recommended for consideration since 1999
Use of trade names and commercial sources is for identification only and does not imply endorsement by the U.S. Department of
Health and Human Services. |
All MMWR HTML versions of articles are electronic conversions from typeset documents. This conversion might result in character translation or format errors in the HTML version. Users are referred to the electronic PDF version (http://www.cdc.gov/mmwr) and/or the original MMWR paper copy for printable versions of official text, figures, and tables. An original paper copy of this issue can be obtained from the Superintendent of Documents, U.S. Government Printing Office (GPO), Washington, DC 20402-9371; telephone: (202) 512-1800. Contact GPO for current prices.
**Questions or messages regarding errors in formatting should be addressed to mmwrq@cdc.gov.Date last reviewed: 7/2/2009