
Persons using assistive technology might not be able to fully access information in this file. For assistance, please send e-mail to: mmwrq@cdc.gov. Type 508 Accommodation and the title of the report in the subject line of e-mail.
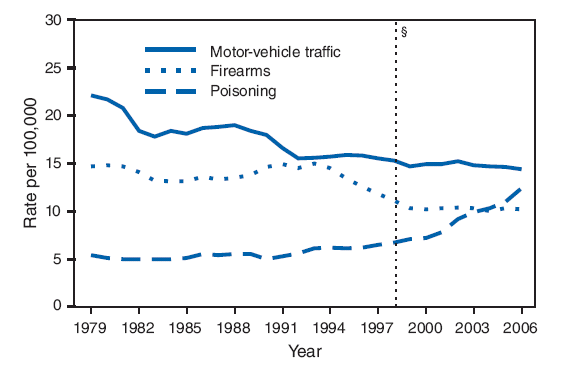
QuickStats: Age-Adjusted Death Rates Per 100,000 Population* for the Three Leading Causes of Injury† Death --- United States, 1979--2006
* Age-adjusted to the 2000 U.S. standard population.
† Injuries are from all manners, including unintentional, suicide, homicide, undetermined intent, legal intervention, and operations of war. Poisoning deaths include those resulting from drug overdose, those resulting from other misuse of drugs, and those associated with solid or liquid biologic substances, gases or vapors, or other substances such as pesticides or unspecified chemicals.
§ In 1999, International Classification of Diseases, 10th Revision (ICD-10) replaced the previous revision of the ICD (ICD-9). This resulted in approximately 5% fewer deaths being classified as motor-vehicle traffic--related deaths and 2% more deaths being classified as poisoning-related deaths. Therefore, death rates for 1998 and earlier are not directly comparable with those computed after 1998. Little change was observed in the classification of firearm-related deaths from ICD-9 to ICD-10.
Motor-vehicle traffic, poisoning, and firearms were the three leading causes of injury deaths in the United States in 2006. Age-adjusted death rates for motor-vehicle traffic--related deaths and deaths from firearms decreased from 1979 to 2006, whereas the rate for poisoning more than doubled during the same period. From 2005 to 2006, the age-adjusted poisoning death rate increased 13%, whereas motor-vehicle traffic and firearm death rates remained unchanged.
SOURCES: National Vital Statistics System, mortality data, available at http://www.cdc.gov/nchs/deaths.htm (for 2006 rates); and CDC WONDER, compressed mortality file, underlying cause-of-death, available at http://wonder.cdc.gov/mortsql.html (for 1979--2005 rates).
Alternative Text: The figure above shows age-adjusted death rates per 100,000 population for the three leading causes of injury deaths from 1976 through 2006 in the United States. Motor-vehicle traffic, poisoning, and firearms were the three leading causes of injury deaths in the United States in 2006. Age-adjusted death rates for motor-vehicle traffic-related deaths and deaths from firearms decreased from 1979 to 2006, whereas the rate for poisoning more than doubled during the same period. From 2005 to 2006, the age-adjusted poisoning death rate increased 13%, whereas motor-vehicle traffic and firearm death rates remained unchanged.