
Persons using assistive technology might not be able to fully access information in this file. For assistance, please send e-mail to: mmwrq@cdc.gov. Type 508 Accommodation and the title of the report in the subject line of e-mail.
Alcohol and Suicide Among Racial/Ethnic Populations --- 17 States, 2005--2006
During 2001--2005, an estimated annual 79,646 alcohol-attributable deaths (AAD) and 2.3 million years of potential life lost (YPLL) were attributed to the harmful effects of excessive alcohol use (1). An estimated 5,800 AAD and 189,667 YPLL were associated annually with suicide (1). The burden of suicide varies widely among racial and ethnic populations in the United States, and limited data are available to describe the role of alcohol in suicides in these populations. To examine the relationship between alcohol and suicide among racial/ethnic populations, CDC analyzed data from the National Violent Death Reporting System (NVDRS) for the 2-year period 2005--2006 (the most recent data available). This report summarizes the results of that analysis, which indicated that the overall prevalence of alcohol intoxication (i.e., blood alcohol concentration [BAC] at or above the legal limit of 0.08 g/dL) was nearly 24% among suicide decedents tested for alcohol, with the highest percentage occurring among American Indian/Alaska Natives (AI/ANs) (37%), followed by Hispanics (29%) and persons aged 20--49 years (28%). These results indicate that many populations can benefit from comprehensive and culturally appropriate suicide-prevention strategies that include efforts to reduce alcohol consumption, especially programs that focus on persons aged <50 years.
NVDRS is an active, state-based surveillance system that collects information on homicides, suicides, deaths of undetermined intent, deaths from legal intervention (e.g., involving a person killed by an on-duty police officer), and unintentional firearm deaths. Suicide decedents are identified as those with death certificates that list International Classification of Diseases, 10th Revision codes X60--84 or Y87.0 as the primary cause of death. Information on race and ethnicity are recorded as separate items in NVDRS consistent with other vital statistics reporting; for this analysis, CDC used five racial/ethnic categories: Hispanic, non-Hispanic white, non-Hispanic black, non-Hispanic AI/AN, and non-Hispanic Asian/Pacific Islander (A/PI). Analysis was limited to persons aged ≥10 years. Data from 2 years, 2005 and 2006, were aggregated to produce more stable estimates than could be obtained from an analysis of data from a single year.
A total of 19,255 suicides occurred in the 17 states contributing data to NVDRS during 2005--2006 (Alaska, California,* Colorado, Georgia, Kentucky, Massachusetts, Maryland, North Carolina, New Jersey, New Mexico, Oklahoma, Oregon, Rhode Island, South Carolina, Utah, Virginia, and Wisconsin) (2). This analysis excluded 21 decedents because they were aged <10 years or of unknown age and 240 decedents who were classified as "other" race or unknown race and/or ethnicity, resulting in a final sample of 18,994.
Alcohol-related information was assessed by NVDRS through questions asked of next of kin, judgment by medical or law enforcement officials, or laboratory data.† Information collected related to 1) the decedent's alcohol dependence or problem (whether the victim was perceived by self or others to have a problem with, or to be addicted to, alcohol); 2) suspected alcohol use (whether alcohol use by the decedent in the hours preceding the incident was suspected, based on witness or investigator reports or circumstantial evidence, such as empty alcohol containers around the decedent); 3) testing for alcohol (i.e., whether the decedents blood was tested for the presence of alcohol); 4) alcohol test results (recorded as positive, negative, not applicable [i.e., not tested], or unknown); and 5) the decedent's BAC measured in g/dL. A BAC ≥0.08 g/dL was used to define intoxication consistent with the standard set by the U.S. Department of Transportation (3). Coroner and medical examiner records indicated that nearly 70% of the decedents were tested for BAC. The analysis of BAC excluded persons not tested for alcohol and persons who were tested for alcohol but for whom no quantitative values were recorded.
BAC was examined both as a continuous variable and as a multiple of the legal limit (≥0.24, ≥0.16, ≥0.08, and <0.08 g/dL, and three times, two times, or any level greater than or equal to the legal limit for intoxication versus below the limit). Prevalence estimates and confidence intervals were calculated, and statistical significance was assessed by a chi-square test.
The highest percentage of suicide decedents characterized as dependent on alcohol was observed among non-Hispanic AI/ANs (21%); the lowest percentage was observed among non-Hispanic blacks (7%) (Table). Recent alcohol use was suspected in approximately 46% of non-Hispanic AI/ANs, nearly 30% of Hispanics, and 26% of non-Hispanic whites.
The highest percentage of suicide decedents tested for alcohol was among non-Hispanic blacks (76%). Alcohol was detected in the blood of 33.2% of decedents tested, with the highest percentages occurring among non-Hispanic AI/AN (45.5%) and Hispanic (39.0%) subjects tested (Table).
For all age groups, the highest percentage of decedents with BACs ≥0.08 g/dL was among AI/ANs aged 30--39 years (54.3%), followed by AI/AN and Hispanic decedents aged 20--29 years (50.0% and 37.3%, respectively). Among decedents tested who were aged 10--19 years (all of whom were under the legal drinking age in the United States), 12% had BACs ≥0.08 g/dL; the levels ranged from 1.3% in non-Hispanic blacks to 28.6% in non-Hispanic A/PIs (Figure 1). Among male decedents tested, 25% tested above legal intoxication; among females tested, 18% tested above legal intoxication (Figure 2). Males had a significantly higher percentage with BACs ≥0.08 g/dL than females (p<0.02, by chi-square test) in all racial/ethic populations except non-Hispanic AI/ANs, for whom the percentages for each sex were equal (37%) (p=0.99, by chi-square test).
Reported by: AE Crosby, MD, V Espitia-Hardeman, MSc, HA Hill, MD, PhD, L Ortega, MD, C Clavel-Arcas, MD, National Center for Injury Prevention and Control, CDC.
Editorial Note:
Researchers have proposed various mechanisms regarding the role of acute or chronic alcohol use in suicidal behavior (4). These include alcohol's effect on promoting depression and hopelessness, promoting disinhibition of negative behavior and impulsivity, impairing problem solving, and contributing to disruption in interpersonal relationships (4). Although numerous studies show that alcohol use often plays a role in suicide, the association can vary from population to population. The results of this analysis indicate that alcohol intoxication likely was present in nearly one quarter of the tested suicide deaths recorded by NVDRS in 17 states during 2005--2006; especially among non-Hispanic AI/ANs and Hispanics. Racial/ethnic differences in the prevalence of problem drinking cannot explain the pattern in alcohol-associated suicides. Data from the Behavioral Risk Factor Surveillance System that examined binge drinking among different racial/ethnic populations showed that the highest percentage occurred among Hispanics (5).
The analysis by sex reveals that the percentage(s) of tested subjects with BACs at or over the legal limit for intoxication was higher for males than females in all racial/ethnic populations except non-Hispanic AI/ANs, for whom the percentage(s)for each sex were equal. Among suicide decedents, other studies also show higher levels of intoxication among males compared with females (4).
The findings of this report are subject to at least five limitations. First, police and coroner records might estimate alcohol use inaccurately because persons considered unlikely to have been drinking often are not tested. For example, one study showed that women were rarely tested for alcohol, and males aged ≥60 years were tested less commonly than young adult males (6). Second, injury mortality deaths probably underestimate from 25% to 35% the actual numbers for AI/ANs and certain other racial/ethnic populations, such as Hispanics, because of the misclassification of race/ethnicity of decedents on death certificates (7). Third, incorrect or incomplete information might have resulted in misclassification of the intent of the deceased, especially when distinguishing among suicide, undetermined deaths, and unintentional injury deaths (4). Studies estimate that 2%--45% of suicides are misclassified as other causes, whereas few (zero to 1%) deaths classified as suicides have been found to be actually attributable to other causes (4). Fourth, autopsy practices and laboratory protocols differ from jurisdiction to jurisdiction, potentially leading to uneven assessment of alcohol-related factors. NVDRS provides some recommendations for participating states that can reduce these differences (2,6), but the extent to which these recommendations have led to improvements is not known. Finally, these results reflect the data from the 17 states studied and are not nationally representative.
Effective, comprehensive suicide-prevention programs have been developed. These programs focus on an array of risk or protective factors, including alcohol consumption, substance misuse, and social support; however, few have been developed specifically for minority populations (4). Some international studies suggest that measures to restrict alcohol use can reduce suicides (8). The measures include raising the minimum legal drinking age; increasing taxes on alcohol sales; limiting the sale of alcohol products by age of purchaser, time of day available, or business type; and mandating that workplaces be alcohol-free. An example of a successful comprehensive prevention program that included a component addressing alcohol misuse and was implemented in an AI/AN community is the Natural Helpers program (9). This multicomponent program involved personnel who were trained to respond to young persons in crisis, notify mental health professionals in the event of a crisis, and provide health education in the schools and community. Other program components included outreach to families after a suicide or traumatic death, immediate response and follow-up for reported at-risk youth, alcohol and substance-abuse programs, community education about suicide prevention, and suicide-risk screening in mental health and social service programs.
Acknowledgments
This report is based, in part, on contributions by NVDRS staff at state health departments; and L Frazier and J Barnes, National Center for Injury Prevention and Control, CDC.
References
- CDC. Alcohol-related disease impact (ARDI). Atlanta, GA: US Department of Health and Human Services; 2008. Available at http://www.cdc.gov/alcohol/ardi.htm.
- Paulozzi L, Mercy J, Frazier L, Annest L; CDC. CDC's National Violent Death Reporting System: background and methodology. Inj Prev 2004;10:47--52.
- US Department of Health and Human Services. The Surgeon General's call to action to prevent and reduce underage drinking. Rockville, MD: US Department of Health and Human Services; 2007. Available at http://www.surgeongeneral.gov/topics/underagedrinking.
- Goldsmith SK, Pellmar TC, Kleinman AM, Bunney WE, eds. Reducing suicide: a national imperative. Washington, DC: National Academies Press; 2002.
- Naimi TS, Brewer RD, Molded A, Denny C, Ferula MK, Marks JS. Binge drinking among US adults. JAMA 2003;289:70--5.
- Timmermans S. Postmortem: how medical examiners explain suspicious deaths. Chicago, IL: University of Chicago Press; 2006.
- Arias E, Schauman WS, Eschbach K, Sorlie PD, Backlund E. The validity of race and Hispanic origin reporting on death certificates in the United States. Vital Health Stat 2 2008;148:1--23.
- Mann JJ, Apter A, Bertolote J, et al. Suicide prevention strategies: a systematic review. JAMA 2005;294:2064--74.
- May PA, Serna P, Hurt L, DeBruyn LM. Outcome evaluation of a public health approach to suicide prevention in an American Indian tribal nation. Am J Public Health 2005;95:1238--44.
* The California system covers four major metropolitan counties.
† Additional information about NVDRS methods is available at http://www.cdc.gov/ncipc/pub-res/nvdrs-coding/vs3/nvdrs_coding_manual_version_3-a.pdf and http://www.cdc.gov/mmwr/preview/mmwrhtml/ss5801a1.htm.
FIGURE 1. Percentage of suicide decedents with blood alcohol concentrations (BACs) ≥0.08 g/dL,* by race/ethnicity and age group† --- National Violent Death Reporting System, 17 states, 2005--2006
* Sample sizes are based on the number of decedents tested for alcohol minus the number for whom the BAC value was unknown.
† Among those with known test results.
§ 95% confidence interval.
Alternative Text: The figure above shows the percentage of suicide decedents with blood alcohol concentrations (BAC) >0.08 g/dL, by race/ethnicity and age group for 17 states during 2005-2006, according to the National Violent Death Reporting System. For all age groups, the highest proportion of decedents with BACs >0.08 g/dL was among American Indians/Alaska Natives (AI/ANs) aged 30-39 years, followed by AI/AN and Hispanic decedents aged 20-29 years. Among decedents tested who were aged 10-19 years (all of whom were under the legal drinking age in the United States), 12% had BACs >0.08 g/dL; the levels ranged from 1% in non-Hispanic blacks to 29% in non-Hispanic Asians/Pacific Islanders.
FIGURE 2. Percentage of suicide decedents with blood alcohol concentrations (BACs) ≥0.08 g/dL,* by race/ethnicity and sex† --- National Violent Death Reporting System, 17 states, 2005--2006
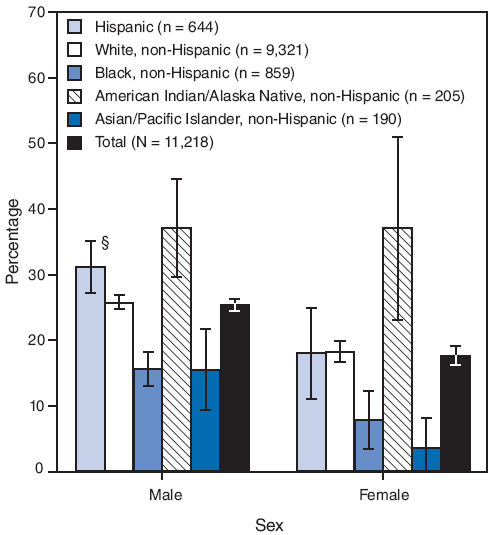
* Sample sizes are based on the number of decedents tested for alcohol minus the number for whom the BAC value was unknown.
† Among those with known test results.
§ 95% confidence interval.
Alternative Text: The figure above shows the percentage of suicide decedents with blood alcohol concentrations (BAC) >0.08 g/dL, by race/ethnicity and sex for 17 states during 2005-2006, according to the National Violent Death Reporting System. Among male decedents tested, 25% tested above legal intoxication; among females tested, 18% tested above legal intoxication. Males had a significantly higher percentage with BACs >0.08 g/dL than females (p<0.02, by chi-square test) in all racial/ethic populations except non-Hispanic American Indians/Alaska Natives, for whom the percentages for each sex were equal (37%) (p=0.99, by chi-square test).
Use of trade names and commercial sources is for identification only and does not imply endorsement by the U.S. Department of
Health and Human Services. |
All MMWR HTML versions of articles are electronic conversions from typeset documents. This conversion might result in character translation or format errors in the HTML version. Users are referred to the electronic PDF version (http://www.cdc.gov/mmwr) and/or the original MMWR paper copy for printable versions of official text, figures, and tables. An original paper copy of this issue can be obtained from the Superintendent of Documents, U.S. Government Printing Office (GPO), Washington, DC 20402-9371; telephone: (202) 512-1800. Contact GPO for current prices.
**Questions or messages regarding errors in formatting should be addressed to mmwrq@cdc.gov.Date last reviewed: 6/18/2009