
Persons using assistive technology might not be able to fully access information in this file. For assistance, please send e-mail to: mmwrq@cdc.gov. Type 508 Accommodation and the title of the report in the subject line of e-mail.
QuickStats: Life Expectancy at Age 65 Years, by Sex and Race --- United States, 2000--2006*
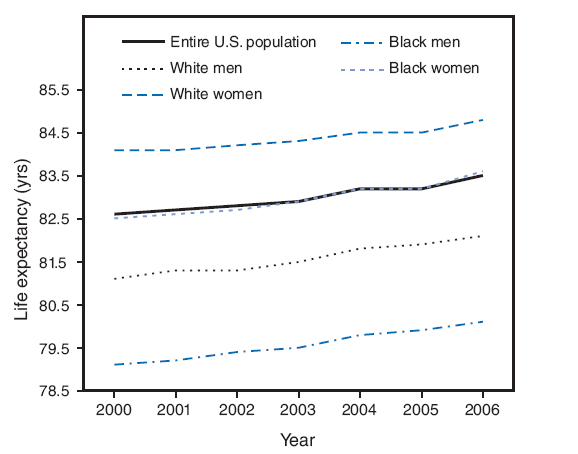
* Data for 2000--2006 are based on a newly revised methodology and might differ from figures previously published. More information on the revised method is available at http://www.cdc.gov/nchs/data/nvsr/nvsr57/nvsr57_14.pdf.
From 2000 to 2006, the most recent years for which data are available, life expectancy at age 65 years increased by 0.9 year for the overall U.S. population, 1.0 year for white men, 0.7 year for white women, 1.0 year for black men, and 1.1 years for black women.
SOURCE: Heron MP, Hoyert DL, Murphy SL, Xu JQ, Kochanek KD, Tejada-Vera B. Deaths: final data for 2006. Natl Vital Stat Rep 2009;57(14). Available at http://www.cdc.gov/nchs/data/nvsr/nvsr57/nvsr57_14.pdf.
Alternative Text: The figure above shows the life expectancy for U.S. residents at age 65, by sex and race, from 1999 through 2006. The data show gradual increases in the number of years from 2000 to 2006 for whites, blacks, men, and women, with the increases ranging from 0.7 years for white women to 1.1 years for black women.
Use of trade names and commercial sources is for identification only and does not imply endorsement by the U.S. Department of
Health and Human Services. |
All MMWR HTML versions of articles are electronic conversions from typeset documents. This conversion might result in character translation or format errors in the HTML version. Users are referred to the electronic PDF version (http://www.cdc.gov/mmwr) and/or the original MMWR paper copy for printable versions of official text, figures, and tables. An original paper copy of this issue can be obtained from the Superintendent of Documents, U.S. Government Printing Office (GPO), Washington, DC 20402-9371; telephone: (202) 512-1800. Contact GPO for current prices.
**Questions or messages regarding errors in formatting should be addressed to mmwrq@cdc.gov.Date last reviewed: 5/7/2009