 |
|
|
|
|
|
|
| ||||||||||
|
|
|
|
|
|
|
||||
| ||||||||||
|
|
|
|
|
Persons using assistive technology might not be able to fully access information in this file. For assistance, please send e-mail to: mmwrq@cdc.gov. Type 508 Accommodation and the title of the report in the subject line of e-mail. Sociodemographic Differences in Binge Drinking Among Adults --- 14 States, 2004Binge drinking, defined in this study as consuming five or more alcoholic drinks on one occasion,* was responsible for 43,731 (54.9%) of the estimated 79,646 alcohol-attributable deaths each year in the United States during 2001--2005.† Healthy People 2010 calls for reducing the prevalence of binge drinking among adults from the 16.6% baseline in 1998 to 6.0% (1). An overarching goal of Healthy People is to eliminate health disparities among different segments of the population.§ To assess binge drinking by sex, age group, race/ethnicity, education level, and income level, CDC analyzed data from an optional module of the 2004 Behavioral Risk Factor Surveillance System (BRFSS) survey, the most recent data available on binge drinking prevalence, frequency, and intensity (i.e., the number of drinks consumed per binge episode). This report summarizes the results of that analysis, which indicated that the prevalence of binge drinking was more common among men (24.3%), persons aged 18--24 years (27.4%) and 2534 years (24.4%), whites (17.5%), and persons with household incomes >$50,000 (17.4%). However, after adjusting for sex and age, the highest average number of binge drinking episodes during the preceding 30 days was reported by binge drinkers whose household income was <$25,000. (4.9), and the highest average number of drinks per binge episode was reported by non-Hispanic blacks (8.4) and Hispanics (8.1). These findings underscore the need to implement effective population-based prevention strategies (e.g., increasing alcohol excise taxes) and develop effective interventions targeted at groups at higher risk. BRFSS conducts annual state-based, random-digit--dialed telephone surveys of the noninstitutionalized U.S. civilian population aged >18 years, collecting data on health conditions and health risk behaviors, including binge drinking. In 2004, an optional survey module with additional questions on binge drinking was administered in 14 states.¶ Binge drinking was defined as having consumed five or more alcoholic drinks on one or more occasions during the preceding 30 days. For this report, responses to questions regarding the prevalence, frequency, and intensity of binge drinking were analyzed, beginning with the question, "Considering all types of alcoholic beverages, how many times during the past 30 days did you have five or more drinks on an occasion?" Those who acknowledged at least one occasion were then asked, "During the most recent occasion when you had five or more alcoholic beverages, about how many beers, including malt liquor, did you drink? ...about how many glasses of wine, including wine coolers, hard lemonade, or hard cider, did you drink? ...about how many drinks of liquor, including cocktails, did you have?" After excluding persons with missing or incomplete information, data from 62,684 respondents in the 14 states were used for analysis. Response rates for each state were calculated using Council of American Survey and Research Organizations (CASRO) guidelines. Response rates ranged from 39.0% (California) to 63.2% (Minnesota) (median: 54.1%, and cooperation rates ranged from 59.9% (California) to 86.9% (Minnesota)(median: 74.9%).** The prevalence of binge drinking was calculated by dividing the total number of respondents who reported at least one binge drinking episode during the preceding 30 days by the total number of BRFSS respondents in the 14 states. Analysis by state was not performed because of multiple subgroups with fewer than 50 respondents. The frequency of binge drinking was calculated by averaging the number of episodes reported by all binge drinkers during the preceding 30 days. The intensity of binge drinking (i.e., number of drinks per binge episode) was calculated by averaging the number of drinks consumed by binge drinkers during their most recent episode. All data were weighted to produce population-based estimates according to age-, race-, and sex-specific state population counts and to the respondent's probability of selection. Data were adjusted to the standard age and sex distribution of 2004 BRFSS respondents to provide estimates for race/ethnicity, education level, and annual household income level. Statistical significance was determined by pairwise linear contrasts of the estimates (2). In 2004, the overall unadjusted prevalence of binge drinking among adults in the 14 states was 15.9% (Table 1). Binge drinking prevalence among men (24.3%) was three times higher than among women (7.9%). Men who reported binge drinking also reported a significantly higher average number of binge drinking episodes during the preceding 30 days (4.6) than women (2.9) and a significantly higher number of drinks consumed during their most recent binge episode (8.3 versus 6.9). Binge drinking prevalence decreased with advancing age, from 27.4% among respondents aged 18--24 years to 3.7% among respondents aged >65 years. In contrast, among binge drinkers, respondents aged >65 years reported the highest average number of binge drinking episodes during the preceding 30 days (6.8). The number of drinks consumed during the most recent binge decreased with advancing age, from 9.8 among adults aged 18--24 years to 6.4 among those aged >65 years. The age- and sex-adjusted prevalence of binge drinking among non-Hispanic whites (17.5%) was significantly higher than the prevalence for Hispanics (14.4%) and non-Hispanic blacks (10.9%) (Table 2). Overall, among binge drinkers, the frequency of binge drinking episodes and the number of drinks consumed during the most recent binge episode were similar among racial/ethnic populations; however, non-Hispanic blacks and Hispanics reported a higher intensity of binge drinking (8.4 and 8.1 drinks per binge episode, respectively) than whites (6.9). College graduates had significantly lower age- and sex-adjusted prevalence of binge drinking (14.5%) than high school graduates or those with some college or technical school (both 17.1%) (Table 2). Respondents who did not graduate from high school reported the lowest binge drinking prevalence (14.2%) but, along with high school graduates, the highest frequency of binge drinking episodes (4.6) and the highest number of drinks consumed in the most recent episode (7.8). In contrast, binge drinking prevalence increased with income level and was highest among respondents with annual household incomes >$50,000 (17.4%) (Table 2). However, the number of drinks consumed per episode was significantly lower among respondents whose household income was >$35,000 compared with those whose household income was <$25,000. Reported by: JL Cremeens, PhD, D Nelson, MD, TS Naimi, MD, RD Brewer, MD, WS Pearson, PhD, Div of Adult and Community Health, National Center for Chronic Disease Prevention and Health Promotion; PR Chavez, PhD, EIS Officer, CDC. Editorial Note:Binge drinking is a risk factor for numerous adverse health and social outcomes, including alcohol poisoning, hypertension, acute myocardial infarction, sexually transmitted infections, unintended pregnancy, fetal alcohol syndrome, sudden infant death syndrome, suicide, interpersonal violence, and motor vehicle crashes (3). This report indicates that binge drinking is common among U.S. adults, especially among whites, males, persons aged 18--34 years, and those with household incomes >$50,000. These sociodemographic characteristics stand in contrast to characteristics for many other health risk factors (e.g., smoking and obesity), where prevalence tends to be higher among minorities and persons with lower education and income (4). The findings in this report highlight the need for assessing the frequency and intensity of binge drinking among binge drinkers in addition to the prevalence of binge drinking in the general population. These additional measures are important because the risk for adverse outcomes (e.g., alcoholic liver disease or traffic fatalities) increases with the frequency of binge drinking and with the amount consumed per binge episode. Furthermore, reductions in the frequency and intensity of binge drinking generally might be expected to occur before reductions in the prevalence of binge drinking. One plausible reason why binge drinking is more prevalent among whites and persons at higher income levels is that, unlike smoking, binge drinking has not been widely recognized as a health risk, subjected to intense prevention efforts, and socially stigmatized (5). The differences in binge drinking among population segments also likely reflects cultural factors and differences in state and local laws (6) that affect the price, availability, and marketing of alcoholic beverages. Finally, the increase in prevalence of binge drinking with increasing income levels likely reflects the fact that persons with higher household incomes have more disposable income available to spend on alcohol. The findings in this report are subject to at least three limitations. First, the 14 states that administered the optional binge drinking module are not necessarily representative of all 50 states; therefore, the results cannot be generalized to the entire U.S. population. Second, BRFSS data are self-reported; alcohol consumption generally, and excessive drinking in particular, are underreported in surveys because of recall bias, social desirability response bias, and nonresponse bias (7). Finally, in 2005, BRFSS changed the definition of binge drinking for women from five or more drinks per occasion to four or more drinks per occasion; the prevalence of binge drinking among women would have been higher using the new definition (8). These findings support the need to implement effective population-based strategies (e.g., increasing alcohol excise taxes, limiting the number of retail outlets where alcohol is sold in a particular geographic area, and maintaining and enforcing age 21 years as the minimum age for legal drinking) (9,10) to prevent binge drinking. In addition, the frequency and intensity of binge drinking should be routinely monitored to guide the development and evaluation of culturally appropriate binge drinking prevention and intervention strategies for groups at greater risk. References
* In 2006, the Behavioral Risk Factor Surveillance System definition of binge drinking for women changed from five alcoholic drinks to four drinks on one occasion. † Estimated using the Alcohol-Related Disease Impact (ARDI) database. Available at http://apps.nccd.cdc.gov/ardi. § Including differences that occur by sex, race/ethnicity, education, income, disability, geographic location, or sexual orientation. ¶ California, Delaware, Idaho, Maine, Michigan, Minnesota, Montana, Nevada, New Hampshire, New Mexico, North Dakota, Virginia, Wisconsin, and Wyoming. ** The response rate is the percentage of persons who completed interviews among all eligible persons, including those who were not successfully contacted. The cooperation rate is the percentage of persons who completed interviews among all eligible persons who were contacted. Table 1 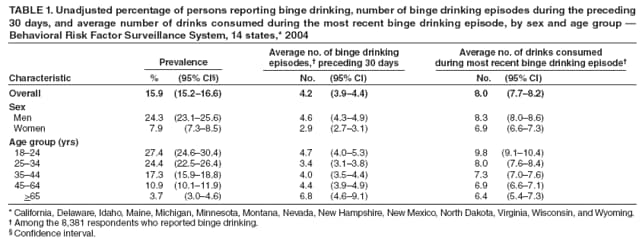 Return to top. Table 2 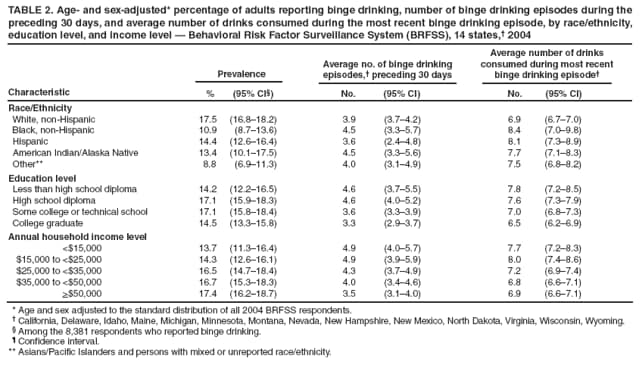 Return to top.
All MMWR HTML versions of articles are electronic conversions from typeset documents. This conversion might result in character translation or format errors in the HTML version. Users are referred to the electronic PDF version (http://www.cdc.gov/mmwr) and/or the original MMWR paper copy for printable versions of official text, figures, and tables. An original paper copy of this issue can be obtained from the Superintendent of Documents, U.S. Government Printing Office (GPO), Washington, DC 20402-9371; telephone: (202) 512-1800. Contact GPO for current prices. **Questions or messages regarding errors in formatting should be addressed to mmwrq@cdc.gov.Date last reviewed: 4/2/2009 |
|||||||||
|