 |
|
|
|
|
|
|
| ||||||||||
|
|
|
|
|
|
|
||||
| ||||||||||
|
|
|
|
|
Persons using assistive technology might not be able to fully access information in this file. For assistance, please send e-mail to: mmwrq@cdc.gov. Type 508 Accommodation and the title of the report in the subject line of e-mail. Racial/Ethnic Disparities in Self-Rated Health Status Among Adults With and Without Disabilities -- United States, 2004 -- 2006Self-rated health status has been found to be an independent predictor of morbidity and mortality (1), and racial/ethnic disparities in self-rated health status persist among the U.S. adult population (2). Black and Hispanic adults are more likely to report their general health status as fair or poor compared with white adults (2). In addition, the prevalence of disability has been shown to be higher among blacks and American Indians/Alaska Natives (AI/ANs) (3). To estimate differences in self-rated health status by race/ethnicity and disability, CDC analyzed data from the 2004 -- 2006 Behavioral Risk Factor Surveillance System (BRFSS) surveys. This report summarizes the results of that analysis, which indicated that the prevalence of disability among U.S. adults ranged from 11.6% among Asians to 29.9% among AI/ANs. Within each racial/ethnic population, adults with a disability were more likely to report fair or poor health than adults without a disability, with differences ranging from 16.8 percentage points among Asians to 37.9 percentage points among AI/ANs. Efforts to reduce racial/ethnic health disparities should explicitly include strategies to improve the health and well being of persons with disabilities within each racial/ethnic population. BRFSS is a state-based, random-digit -- dialed telephone survey of the noninstitutionalized, U.S. civilian population aged >18 years. In 2004, 2005, and 2006, approximately 1 million persons from all 50 states, the District of Columbia, Puerto Rico, and the U.S. Virgin Islands participated in the BRFSS survey.* Consistent with the definition of disability from Healthy People 2010 (4), respondents were asked, "Are you limited in any way in any activities because of physical, mental, or emotional problems?" and "Do you now have any health problem that requires you to use special equipment, such as a cane, a wheelchair, a special bed, or a special telephone?" Participants who responded "yes" to either question were classified as having a disability. To assess self-rated health status, participants were asked, "Would you say that in general your health is excellent, very good, good, fair, or poor?" The following racial/ethnic categories were included in this analysis: white, black, Hispanic, Asian, Native Hawaiian or Other Pacific Islander, and AI/AN.† Data from 2004, 2005, and 2006 were aggregated to provide sufficient power to analyze low-count racial/ethnic populations. Prevalence estimates were weighted and age adjusted to the 2000 U.S. standard population. Weighted population estimates were determined by taking the final weights for each year during 2004 -- 2006 and dividing by three. Data were weighted to compensate for unequal probabilities of selection, to adjust for nonresponse and telephone noncoverage, to ensure that results were consistent with population data, and to make population estimates.§ Prevalence estimates and standard errors were obtained using statistical software to account for the complex sampling design. Chi-square tests were used to compare self-rated health status between racial/ethnic populations and by disability status. Council of American Survey Research Organizations (CASRO) median response rates¶ for the 2004 -- 2006 BRFSS surveys were 52.7% (2004), 51.1% (2005), and 51.4% (2006). The median cooperation rates** for each year were 74.3% (2004), 75.1% (2005), and 74.5% (2006). During 2004 -- 2006, an estimated 19.9% of the total U.S. population aged >18 years (i.e., an average of 43 million persons) had a disability. The prevalence of disability was highest among AI/ANs (29.9%) and lowest among Asians (11.6%) (Table 1). Nearly 84% of the total U.S. adult population reported having good or better health, but substantial variation was observed in self-rated health status across racial/ethnic populations. Nearly 60% of white, Asian, and Native Hawaiian or Other Pacific Islander respondents (59.3%, 55.8%, and 55.4%, respectively) rated their health as very good or excellent, whereas 44.4% of black respondents reported their health to be very good or excellent. White and Asian adults had similar rates of self-rated fair or poor health (12.9% and 10.4%, respectively), whereas fair or poor health was reported more frequently among other minority populations: 21.1% among blacks, 14.8% among Native Hawaiian or Other Pacific Islanders, and 24.5% among AI/ANs. Hispanic adults rated their health status approximately equally across the three health status categories: very good or excellent (33.6%), good (35.4%), and fair or poor (31.1%). Overall, adults with a disability were less likely to report excellent or very good health (27.2% versus 60.2%; p<0.01) and more likely to report fair or poor health (40.3% versus 9.9%; p<0.01), compared with adults without disability (Table 2). White adults without a disability had the highest proportion of respondents who rated their health as very good or excellent (66.9%), whereas 49.9% of black respondents without a disability reported very good or excellent health. Reports of fair or poor health among adults with a disability were most common among Hispanics and AI/ANs (55.2% and 50.5%, respectively) and least common among Asians (24.9%). Reported by: LA Wolf, MPH, BS Armour, PhD, VA Campbell, PhD, Div of Human Development and Disability, National Center for Birth Defects and Developmental Disabilities, CDC. Editorial Note:The Surgeon General's Call to Action to Improve the Health and Wellness of People with Disabilities notes that good health is essential if persons with disabilities are to work, learn, and fully interact with their families and community (5). The concept of health should be the same for persons with and without disabilities (5). As in previous studies (2), the findings in this report indicated that, in 2004 -- 2006, self ratings of fair or poor health were generally higher among black, Hispanic, Native Hawaiian or Other Pacific Islander, and AI/AN adults than among their white and Asian counterparts. Also, as in previous studies (3), the findings in this report show that a higher proportion of persons with disabilities rated their health as fair or poor compared with persons without disabilities. This analysis also determined that the difference in self-rated fair or poor health between persons with and without disabilities varied by race/ethnicity. The absolute difference between persons with and without disabilities ranged from 16.8 percentage points for Asians to 37.9 percentage points for AI/ANs. These differences are attributed, in part, to health-care and wellness promotion services being inaccessible or unavailable for certain persons with disabilities (5). Health-care delivery has been slow to reduce disparities that would enable many persons with disabilities to achieve and maintain a good level of health (5). The findings in this report are subject to at least five limitations. First, BRFSS does not include persons living in institutions or group homes. Therefore, because persons with disabilities are likely to reside in such facilities, the results likely underestimate the actual prevalence of adults with a disability. Second, the BRFSS questions used to define disability do not collect information on the type, severity, duration, or permanence of disability. Therefore, the definition of disability used in this analysis might have captured some persons with relatively minor or short-term disabilities (e.g., a sprained ankle). Third, because of the cross-sectional nature of the data, inferring any direction of causality between disability and fair or poor health is not possible. Fourth, BRFSS is conducted only in English and Spanish, which might preclude participation by persons who speak other languages. In addition, differences in the Spanish translation of the questionnaire might explain some of the health disparities observed in the Hispanic population (6). The Spanish language version of BRFSS uses the Spanish word "regular" for the category of "fair" health, an idiomatic difference that might alter the way the participant understands the question. Finally, racial/ethnic differences in self-rated health and disability might reflect differences in potentially confounding factors, such as education, income, and health insurance status, which are significantly associated with both race/ethnicity and disability and were not controlled for in this analysis (7,8). This is a direction for future work that CDC plans to undertake. Despite efforts to identify and reduce health disparities among racial/ethnic populations in the United States, disproportionately high rates of disability and self-rated fair or poor health persist among certain racial/ethnic populations (9,10). Efforts to reduce health disparities among racial/ethnic populations should also address the needs of adults with disabilities. Such efforts must ensure that persons with disabilities have accessible, available, and appropriate health-care and wellness promotion services (5). References
* Hawaii did not collect data in 2004. † For this report, persons identified as white, black, Asian, Native Hawaiian or Other Pacific Islander, and AI/AN are all non-Hispanic. Persons identified as Hispanic might be of any race. § Additional information available at http://health.utah.gov/opha/ibishelp/brfss/issues.htm. ¶ The percentage of persons who completed interviews among all eligible persons, including those who were not successfully contacted. ** The percentage of persons who completed interviews among all eligible persons who were contacted. Table 1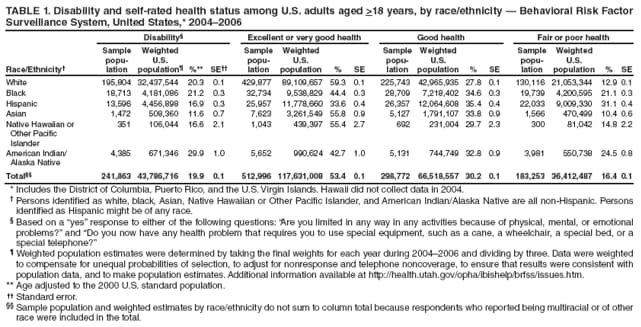 Return to top. Table 2  Return to top.
All MMWR HTML versions of articles are electronic conversions from typeset documents. This conversion might result in character translation or format errors in the HTML version. Users are referred to the electronic PDF version (http://www.cdc.gov/mmwr) and/or the original MMWR paper copy for printable versions of official text, figures, and tables. An original paper copy of this issue can be obtained from the Superintendent of Documents, U.S. Government Printing Office (GPO), Washington, DC 20402-9371; telephone: (202) 512-1800. Contact GPO for current prices. **Questions or messages regarding errors in formatting should be addressed to mmwrq@cdc.gov.Date last reviewed: 10/1/2008 |
|||||||||
|