 |
|
|
|
|
|
|
| ||||||||||
|
|
|
|
|
|
|
||||
| ||||||||||
|
|
|
|
|
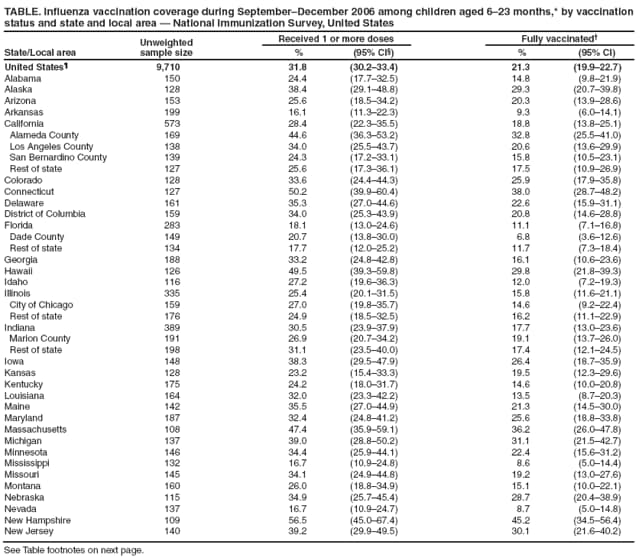
Persons using assistive technology might not be able to fully access information in this file. For assistance, please send e-mail to: mmwrq@cdc.gov. Type 508 Accommodation and the title of the report in the subject line of e-mail. Influenza Vaccination Coverage Among Children Aged 6--23 Months --- United States, 2006--07 Influenza SeasonPlease note: An erratum has been published for this article. To view the erratum, please click here. Children aged <5 years have more influenza-related medical-care visits compared with older children, and those aged <2 years are at the greatest risk for influenza-related hospitalizations (1). In 2002, the Advisory Committee on Immunization Practices (ACIP) encouraged annual influenza vaccination of children aged 6--23 months and then, in 2004, recommended vaccination for this group (2). Two doses, spaced at least 4 weeks apart, are recommended to fully vaccinate children aged <9 years who are receiving influenza vaccination for the first time. This report, based on data from the 2007 National Immunization Survey (NIS), provides an assessment of influenza vaccination coverage among children aged 6--23 months during September--December of the 2006--07 influenza season. Nationally, 31.8% of children received 1 or more doses of influenza vaccine, and 21.3% were fully vaccinated, with substantial variability among states. The findings underscore the need to increase interest in and access to influenza vaccination for more children in the United States. Further study is needed to identify knowledge deficits or logistical barriers that might contribute to continued low influenza vaccination coverage among young children. NIS is an ongoing, random-digit--dialed telephone survey of households with children who are aged 19--35 months at the time of interview, followed by a mail survey of all of the children's vaccination providers to obtain vaccination data (3). The 2007 NIS interviews were conducted during January 4, 2007--February 14, 2008, and included children born during January 5, 2004--July 14, 2006. The survey was conducted in all 50 states and in 14 local areas. Lifetime histories of influenza vaccination were obtained during the mail survey of children's vaccination providers. Two measures of influenza vaccination coverage are reported for children who were aged 6--23 months during the entire span of September--December 2006: 1) receipt of 1 or more doses of influenza vaccine during September--December 2006, and 2) full vaccination. Children were considered fully vaccinated if they had 1) received no doses of influenza vaccine before September 1, 2006, and received 2 doses from September 1, 2006, through the date of interview or January 31, 2007 (whichever was earlier), or 2) received 1 or more doses of influenza vaccine before September 1, 2006, and received 1 or more doses during September--December 2006. The full vaccination measure is based on ACIP recommendations for 2 doses of influenza vaccine for previously unvaccinated children aged <9 years and 1 dose for previously vaccinated children aged <9 years. Later-season vaccination could not be assessed because data collection began in January 2007. NIS methodology, including how responses were weighted, has been described previously (3). Season-to-season comparisons of influenza vaccination coverage were conducted using t-tests, with p<0.05 indicating statistical significance. The household survey response rate was 64.9%. Provider-reported vaccination records were obtained for 17,017 children aged 19--35 months, representing 68.6% of all children with completed household interviews. Of these 17,017 children, 9,710 met the age criteria for this assessment. Of these 9,710, 31.8% received 1 or more doses of influenza vaccine, and 21.3% were fully vaccinated (Table). Nationally, no statistically significant increase was observed in either influenza coverage measure, compared with the previous season (2005--06) (4) (Figure 1). Nearly one third (33.1%) of children who received at least 1 dose during the 2006--07 season required, but did not receive, a second dose by January 31 (or date of interview, if interviewed in January). Substantial variability in influenza vaccination coverage was observed among states and local areas. Among states, percentages of children who were fully vaccinated ranged from 8.6% in Mississippi to 47.6% in Rhode Island (Table). Among the 14 local areas, these percentages ranged from 6.4% in El Paso County, Texas, to 32.8% in Alameda County, California. In the majority of states, no statistically significant increase was observed in the percentage of children who were fully vaccinated, compared with the previous season (Table). The first (or only) influenza vaccine dose was most often administered in weeks 43--46 (i.e., October 22--November 18) or in week 48 (i.e., November 26--December 2), with a drop in doses administered during week 47 (i.e., the period coinciding with the Thanksgiving holiday) (Figure 2). Among children requiring 2 doses (i.e., those with no previous dose), the second dose was most often administered in weeks 48--50 (i.e., November 26--December 10). Reported by: TA Santibanez, PhD, A Fiore, MD, G Mootrey, DO, National Center for Immunization and Respiratory Diseases, CDC. Editorial Note:The findings in this report indicate that, during the 2006--07 influenza season, the third season since ACIP issued its recommendation for annual influenza vaccination for all children aged 6--23 months, only one in five children aged 6--23 months were fully vaccinated. Prevention of influenza and its complications among infants and young children is a public health priority because they are at greater risk for influenza complications, compared with older children. Vaccination coverage for other newly recommended infant vaccines has reached approximately 75% within 7 years of introduction (5). However, influenza vaccination coverage for children aged 6--23 months has remained low, suggesting the possible influence of factors unique to influenza vaccination, including 1) the need for annual vaccination and difficulties in scheduling annual vaccination for this large cohort of children, 2) characteristics of vaccine distribution systems at the local level (e.g., uncertainties about when and how vaccine will be delivered) leading to an inability to reliably schedule vaccination clinics, and 3) a lack of parental or provider confidence or interest in influenza prevention through vaccination. Additional studies are needed to identify barriers to improving vaccination coverage among young children. Little is known about how parental and provider concerns about influenza vaccine effectiveness or safety, or the lack of understanding of the rationale for influenza vaccination recommendations, might contribute to low coverage. Because low vaccination coverage might be attributed, in part, to the narrow time window for influenza vaccination, ACIP has recommended that 1) providers begin to offer influenza vaccination as soon as vaccine becomes available and, if possible, by early October, and 2) vaccination efforts continue throughout the influenza season (1). These recommendations are especially important for children who require 2 doses of vaccine and for other persons who remain unvaccinated after November. Peak influenza activity has occurred in January or later in >80% of influenza seasons since 1976; in >60% of seasons, the peak was in February or later (1). To promote influenza vaccination through November, December, and beyond, CDC created an annual National Influenza Vaccination Week, which was first observed during November 27--December 3, 2006 (6). For the current influenza season, National Influenza Vaccination Week is planned for the week of December 8--14, 2008.* The limitations of vaccination coverage data obtained through the NIS have been discussed in previous reports (3,5). The findings in this report are subject to at least two additional limitations. First, because NIS interviews were conducted during the influenza season and some children might have received influenza vaccinations after the interview, vaccination coverage likely is underestimated. However, according to National Health Interview Survey data from two recent influenza seasons, approximately 85% of influenza vaccinations among all age groups were administered during September--November (1). Second, coverage estimates might be higher among children included in the NIS, compared with all children who were in the 6--23 month age group at some point during September--December. Groups of children who aged into or out of the 6--23 month cohort (and thus were excluded from the analysis) might be less likely to have been vaccinated because children aged <5 months are not recommended for vaccination and children aged 24--59 months have lower influenza vaccination coverage (1). The continuing low influenza vaccination coverage described in this report underscores the need to identify innovative strategies for increasing influenza vaccination coverage among young children. Health-care providers can play several key roles in efforts to increase influenza vaccination. For example, they can routinely inform parents about the substantial burden of influenza illness among young children and the benefits and safety of preventing influenza with vaccination. Additionally, they can use strategies shown to be successful at reducing missed opportunities for vaccination, including standing orders to offer vaccine to all patients throughout the influenza season, vaccination-only clinics, and reminder/recall systems (7,8). Beginning with the 2008--09 influenza season, ACIP has expanded its recommendation for universal influenza vaccination to include all children aged 5--18 years, in addition to those aged 6--59 months, for whom vaccination was recommended previously (1). Vaccination providers and programs should continue to focus vaccination efforts on fully vaccinating children and adolescents at greater risk for influenza complications (including children aged 6--23 months, who are at the greatest risk for influenza-related hospitalizations) as they transition to routinely vaccinating all children and adolescents (1). References
* Additional information available at http://www.cdc.gov/flu/nivw.
Figure 1
All MMWR HTML versions of articles are electronic conversions from typeset documents. This conversion might result in character translation or format errors in the HTML version. Users are referred to the electronic PDF version (http://www.cdc.gov/mmwr) and/or the original MMWR paper copy for printable versions of official text, figures, and tables. An original paper copy of this issue can be obtained from the Superintendent of Documents, U.S. Government Printing Office (GPO), Washington, DC 20402-9371; telephone: (202) 512-1800. Contact GPO for current prices. **Questions or messages regarding errors in formatting should be addressed to mmwrq@cdc.gov.Date last reviewed: 9/25/2008 |
|||||||||
|

![TABLE. (Continued) Influenza vaccination coverage during September–December 2006 among children aged 6–23 months, by vaccination status and state and local area — National Immunization Survey, United States
State/Local area
Unweighted
sample size
Received 1 or more doses
Fully vaccinated
%
(95% CI)
%
(95% CI)
New Mexico
159
33.3
(24.3–43.7)
21.3
(14.0–30.9)
New York
302
37.8
(31.3–44.9)
28.4
(22.4–35.2)
City of New York
172
34.8
(27.0–43.6)
26.8
(19.8–35.2)
Rest of state
130
40.6
(30.5–51.5)
29.8
(20.8–40.7)
North Carolina
154
43.1
(33.6–53.3)
27.4
(19.5–37.0)
North Dakota
156
46.4
(37.9–55.0)
39.4
(31.4–48.1)
Ohio
173
36.4
(28.8–44.9)
25.7
(19.1–33.7)
Oklahoma
140
26.5
(17.4–38.2)
11.9
(7.6–18.1)
Oregon
116
24.5
(17.1–33.9)
11.2
(6.6–18.3)
Pennsylvania
296
43.6
(36.6–50.8)
31.8
(25.6–38.7)
Philadelphia County
121
37.5
(28.0–48.1)
25.3
(17.5–35.0)
Rest of state
175
44.8
(36.7–53.2)
33.1
(25.9–41.2)
Rhode Island
137
59.6
(49.0–69.4)
47.6
(37.4–58.0)
South Carolina
229
20.8
(15.7–27.1)
13.3
(9.4–18.6)
South Dakota
146
36.1
(27.3–46.0)
22.8
(15.9–31.7)
Tennessee
152
29.7
(21.0–40.1)
21.2
(13.5–31.6)
Texas
827
30.8
(25.2–36.9)
17.3
(13.3–22.2)
Bexar County
178
31.6
(23.7–40.8)
17.9
(12.2–25.5)
City of Houston
194
23.3
(17.5–30.4)
17.3
(12.3–23.6)
Dallas County
161
22.9
(16.8–30.3)
13.7
(9.5–19.2)
El Paso County
134
18.0
(11.7–26.6)
6.4
(3.1–12.6)
Rest of state
160
34.6
(26.3–43.9)
18.7
(12.8–26.4)
Utah
198
32.8
(25.4–41.1)
21.3
(15.4–28.8)
Vermont
123
43.9
(33.5–54.9)
37.6
(27.8–48.6)
Virginia
192
37.1
(29.5–45.4)
26.1
(19.6–33.9)
Washington
286
25.5
(19.7–32.3)
16.3
(11.6–22.3)
Western Washington
160
25.2
(18.9–32.9)
15.5
(10.7–21.9)
Rest of state
126
25.6
(18.5–34.2)
16.5
(10.9–24.2)
West Virginia
160
27.2
(20.2–35.4)
15.8
(10.7–22.8)
Wisconsin
134
45.4
(35.2–56.0)
39.2
(29.4–49.9)
Wyoming
142
27.8
(19.5–38.0)
19.9
(12.6–29.9)
* N = 9,710 (unweighted). These influenza vaccination coverage measures represent a subset of children included in the 2007 National Immunization Survey. Only those children who were aged 6–23 months during the entire period of September–December 2006 and who had provider-reported immunization records are included.
† Children were considered fully vaccinated if they had 1) received no doses of influenza vaccine before September 1, 2006, and received 2 doses from September 1, 2006, through the date of interview or January 31, 2007 (whichever was earlier), or 2) received 1 or more doses of influenza vaccine before September 1, 2006, and received 1 or more doses during September–December 2006. Compared with the previous influenza season, the percentage of children who were fully vaccinated significantly increased in three states (Michigan [13.5], New Jersey [12.9], and Mississippi [7.0]) and decreased in two states (Oklahoma [-11.0] and Washington [-8.6]); no significant changes were observed in the remaining states.
§ Confidence interval.
¶ The National Health Interview Survey coverage estimate for 1 or more doses of influenza vaccine, based on parental report, was 46.4% (95% CI = 39.7–53.2; n = 368) for the entire 2006–07 season.](figures/m738a2tc.gif)