|
|
|
|
|
|
|
| ||||||||||
|
|
|
|
|
|
|
||||
| ||||||||||
|
|
|
|
|
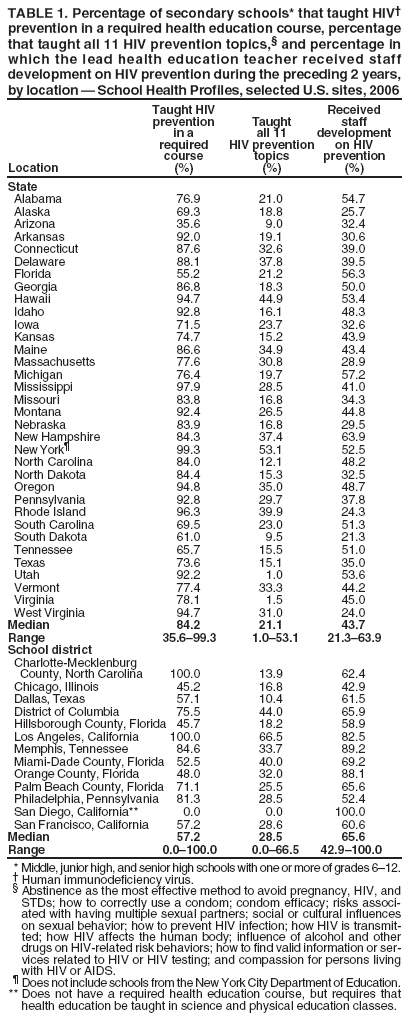
Persons using assistive technology might not be able to fully access information in this file. For assistance, please send e-mail to: mmwrq@cdc.gov. Type 508 Accommodation and the title of the report in the subject line of e-mail. HIV Prevention Education and HIV-Related Policies in Secondary Schools --- Selected Sites, United States, 2006Persons who engage in sexual risk behaviors are at increased risk for human immunodeficiency virus (HIV) infection. School health education can help reduce the prevalence of sexual risk behaviors among students (1). In addition, school health policies can help protect the rights and health of HIV-infected students and staff members and reduce the likelihood of transmitting HIV infection to others (2). To determine the prevalence and extent of HIV prevention education and the prevalence of HIV infection policies among public secondary schools,* CDC analyzed data from the 2006 School Health Profiles for schools in 36 states and 13 large urban school districts. The results of that analysis indicated that, in 2006, the majority of secondary schools included HIV prevention in a required health education course (state median: 84.2%; district median: 57.2%); however, few secondary schools (state median: 21.1%; district median: 28.5%) taught all 11 topics listed in the questionnaire related to HIV prevention. Approximately half of schools (state median: 51.6%; district median: 48.3%) had a policy regarding students or staff members with HIV infection or acquired immunodeficiency syndrome (AIDS). To help reduce HIV-related risk behavior and protect the rights and health of HIV-infected students and staff members, schools should increase efforts to teach all HIV prevention topics and implement policies regarding students or staff members with HIV infection. School Health Profiles surveys have been conducted biennially since 1994 to assess school health programs (3). States and large school districts participate in the surveys, selecting either all public secondary schools within their jurisdictions or systematic, equal-probability, representative samples of schools.† At each school, the principal and lead health education teacher are sent questionnaires to be self-administered and returned to the state or local agency conducting the survey. Participation in School Health Profiles is confidential and voluntary. In 2006, lead health education teachers were asked questions regarding the content of required health education courses and staff development on health education topics. Principals were asked questions regarding policies on students or staff members with HIV infection or AIDS. Follow-up telephone calls and written reminders were used to encourage participation. Data from each questionnaire were cleaned and edited by CDC. Those surveys that used a representative sample of schools, had appropriate documentation, and achieved a response rate of 70% or higher were weighted to reflect the likelihood of schools being selected and to adjust for differing patterns of nonresponse. For the 2006 School Health Profiles survey, lead health education teachers were asked the following questions: 1) "During this school year, have teachers in this school tried to increase student knowledge on each of the following topics in a required health education course in any of grades 6 through 12?" Respondents were asked to indicate yes or no on a list of topics that included "HIV prevention." 2) "During this school year, did teachers in this school teach each of the following pregnancy, HIV, or sexually transmitted disease (STD) prevention topics in a required health education course for students in any of grades 6 through 12?" The following 11 topics were listed: abstinence as the most effective method to avoid pregnancy, HIV, and STDs; how to correctly use a condom; condom efficacy; risks associated with having multiple sexual partners; social or cultural influences on sexual behavior; how to prevent HIV infection; how HIV is transmitted; how HIV affects the human body; influence of alcohol and other drugs on HIV-related risk behaviors; how to find valid information or services related to HIV or HIV testing; and compassion for persons living with HIV or AIDS. 3) "During the past 2 years, did you receive staff development (such as workshops, conferences, continuing education, or any other kind of in-service) on each of the following health education topics?" Respondents were asked to indicate yes or no on a list of topics that included "HIV prevention." Principals were asked the following question: "Has this school adopted a policy on students and/or staff who have HIV infection or AIDS?" In 2006, 34 states and 13 large urban school districts§ met the criteria for both their principal and lead health education teacher surveys to be weighted and two states¶ met the criteria for the principal survey only. Among states, the number of lead health education teachers who participated ranged from 68 to 659 (median: 250), and response rates ranged from 70% to 91% (median: 77%); among school districts, the number of lead health education teachers ranged from 32 to 212 (median: 56), and response rates ranged from 70% to 100% (median: 79%). Among states, the number of principals who participated ranged from 68 to 661 (median: 262), and response rates ranged from 70% to 91% (median: 78%); among school districts, the number of principals ranged from 31 to 234 (median: 55), and response rates ranged from 71% to 98% (median: 79%). Only 21 states and eight large urban school districts that obtained weighted data in both 1996 and 2006 were included in comparisons of data for those 2 years. The Wilcoxon rank-sum test, a nonparametric analogue to a two-sample t-test, was used to test for differences across states and school districts. Differences were considered statistically significant at p<0.05. The percentage of secondary schools that taught HIV prevention in a required health education course ranged from 35.6% to 99.3% (median: 84.2%) among states, and from 0.0% to 100.0% (median: 57.2%) among school districts (Table 1). The percentage of schools that taught all 11 HIV prevention topics ranged from 1.0% to 53.1% (median: 21.1%) among states and from 0.0% to 66.5% (median: 28.5%) among school districts. The percentage of secondary schools that taught how to correctly use a condom ranged from 1.0% to 59.1% (median: 24.3%) among states and from 0.0% to 74.8% (median: 33.7%) among school districts. The percentage that taught about condom efficacy ranged from 11.7% to 90.0% (median: 56.0%) among states and from 0.0% to 91.1% (median: 56.0%) among school districts. For the other nine HIV prevention topics the median percentage of secondary schools that taught each in a required health education course ranged from 64.1% (how to find valid information or services related to HIV or HIV testing) to 78.7% (how HIV is transmitted) among states and from 50.0% (social or cultural influences on sexual behavior) to 57.2% (six different topics) among school districts. The percentage of secondary schools in which the lead health education teacher received staff development on HIV prevention during the 2 years preceding the survey ranged from 21.3% to 63.9% (median: 43.7%) among states and from 42.9% to 100.0% (median: 65.6%) among school districts (Table 1). The percentage of secondary schools with a policy regarding students or staff members with HIV infection or AIDS ranged from 27.0% to 89.5% (median: 51.6%) among states and from 28.1% to 100.0% (median: 48.3%) among school districts (Table 2). The median percentage of schools with such a policy decreased from 71.9% in 1996 to 52.9% in 2006 among states and from 86.2% to 49.2% among school districts, when analysis was limited to comparing results from the same 21 states and eight school districts in each year. Reported by: A Balaji, PhD, N Brener, PhD, L Kann, PhD, L Romero, DrPH, H Wechsler, EdD, Div of Adolescent and School Health, National Center for Chronic Disease Prevention and Health Promotion, CDC. Editorial Note:The findings in this report indicate that, in 2006, the majority of secondary schools in 34 states and 13 school districts provided some education on HIV prevention topics in required health education courses. However, more than half the states that conducted surveys reported that less than one fourth of their schools taught all 11 HIV prevention topics listed in the questionnaire; more than half the school districts that conducted surveys reported that less than one third of their schools taught all 11 topics. Health education can increase knowledge and skills regarding how to avoid HIV infection (4). This analysis also indicated that a median of less than 50% of lead health education teachers among states and a median of approximately two thirds among school districts had received staff development on HIV prevention. Staff development on health topics is critical for effective teaching (5). The finding that in approximately half of the states and school districts conducting surveys, less than 50% of secondary schools had a policy on students or staff members with HIV infection or AIDS is consistent with previously reported national data (6). In addition, the median percentage of schools with such a policy has decreased since 1996. Reasons for these decreases warrant further investigation. Policies for addressing HIV infection in the school setting can provide guidance, support, and protection to those who are infected and to other students and staff members, families, and community members. These groups, along with public health and legal professionals, should work together to develop and implement HIV-related policies and continually assess them, based on new legislation, scientific data, and real-world experience (2). The findings in this report are subject to at least three limitations. First, these data apply only to public secondary schools and, therefore, do not reflect practices at private schools or elementary schools. Second, these data were self-reported by principals and lead health education teachers and were not verified by other sources. Finally, these data were collected during spring and fall 2006 and do not reflect any state, district, or school policies enacted, modified, or discontinued since then. Despite limitations, School Health Profiles remains an important tool for states and school districts to monitor the current status of HIV prevention education and HIV-related policies. These data can be used by public health and education agencies to assist schools in improving their HIV prevention curricula and HIV-related policies. Acknowledgments The findings in this report are based on data collected by state and local School Health Profiles coordinators. References
* Middle, junior high, and senior high schools with one or more of grades 6--12. † In the 2006 survey, statewide samples were representative of all public secondary schools in the state with two exceptions: no schools from the New York City Department of Education were included in the New York state sample, and no schools from the Chicago Public Schools were included in the Illinois sample. § States: Alabama, Alaska, Arizona, Arkansas, Connecticut, Delaware, Florida, Georgia, Hawaii, Idaho, Iowa, Kansas, Maine, Massachusetts, Michigan, Mississippi, Missouri, Montana, Nebraska, New Hampshire, New York, North Carolina, North Dakota, Oregon, Pennsylvania, South Carolina, South Dakota, Tennessee, Texas, Utah, Vermont, Virginia, and West Virginia. School districts: Charlotte-Mecklenburg County, North Carolina; Chicago, Illinois; Dallas, Texas; District of Columbia; Hillsborough County, Florida; Los Angeles, California; Memphis, Tennessee; Miami-Dade County, Florida; Orange County, Florida; Palm Beach County, Florida; Philadelphia, Pennsylvania; San Diego, California; and San Francisco, California. ¶ Illinois and Washington. Table 1
All MMWR HTML versions of articles are electronic conversions from typeset documents. This conversion might result in character translation or format errors in the HTML version. Users are referred to the electronic PDF version (http://www.cdc.gov/mmwr) and/or the original MMWR paper copy for printable versions of official text, figures, and tables. An original paper copy of this issue can be obtained from the Superintendent of Documents, U.S. Government Printing Office (GPO), Washington, DC 20402-9371; telephone: (202) 512-1800. Contact GPO for current prices. **Questions or messages regarding errors in formatting should be addressed to mmwrq@cdc.gov.Date last reviewed: 7/30/2008 |
|||||||||
|