|
|
|
|
|
|
|
| ||||||||||
|
|
|
|
|
|
|
||||
| ||||||||||
|
|
|
|
|
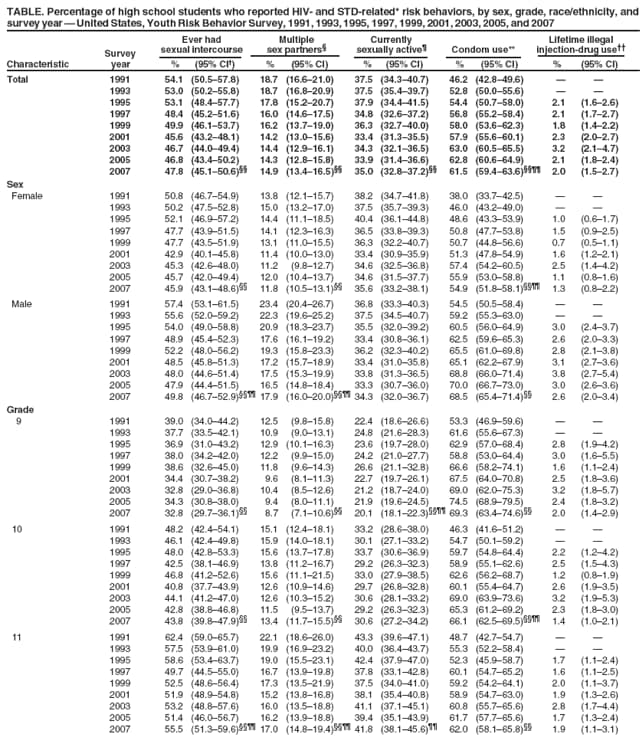
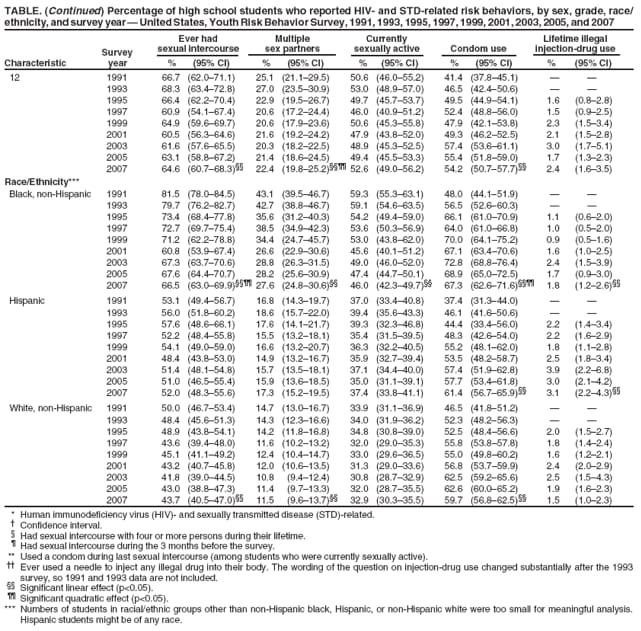
Persons using assistive technology might not be able to fully access information in this file. For assistance, please send e-mail to: mmwrq@cdc.gov. Type 508 Accommodation and the title of the report in the subject line of e-mail. Trends in HIV- and STD-Related Risk Behaviors Among High School Students --- United States, 1991--2007Persons who engage in unprotected sexual intercourse or use injection drugs are at increased risk for human immunodeficiency virus (HIV) infection and sexually transmitted diseases (STDs). Changes in HIV- and STD-related risk behaviors among high school students in the United States during 1991--2005 were reported previously (1). To update these analyses through 2007, CDC analyzed data from nine biennial national Youth Risk Behavior Surveys (YRBS). This report summarizes the results of that analysis, which indicated that, during 1991--2007, the percentage of U.S. high school students who ever had sexual intercourse decreased 12%, the percentage who had sexual intercourse with four or more persons during their lifetime decreased 20%, and the percentage who were currently sexually active decreased 7%. Among students who were currently sexually active, the prevalence of condom use increased 33%. However, these changes in risk behaviors were not observed in some subgroups. In addition, no changes were detected in the prevalence of sexual risk behaviors from 2005 to 2007, and many students still engaged in behaviors that place them at risk for HIV infection and STDs. Additional efforts to reduce sexual risk behaviors, particularly among black, Hispanic, and male students, must be implemented to meet the Healthy People 2010 national health objective for adolescent sexual behaviors (objective no. 25-11) (2) and to decrease rates of HIV infection and STDs. The biennial national YRBS, a component of CDC's Youth Risk Behavior Surveillance System, used independent, three-stage cluster samples for the 1991--2007 surveys to obtain cross-sectional data representative of public and private school students in grades 9--12 in all 50 states and the District of Columbia (3). Sample sizes ranged from 10,904 to 16,296. School response rates ranged from 70% to 81%, and student response rates ranged from 83% to 90%; therefore, overall response rates for the surveys ranged from 60% to 70%. For each cross-sectional national survey, students completed anonymous, self-administered questionnaires that included identically worded questions about sexual intercourse, number of sex partners, condom use, and injection-drug use.* Sexual experience was defined as ever having had sexual intercourse. Multiple sex partners was defined as having four or more sex partners during one's lifetime. Current sexual activity was defined as having sexual intercourse during the 3 months before the survey. Condom use was defined as use of a condom during last sexual intercourse among currently sexually active students. Injection-drug use was defined as ever having used a needle to inject any illegal drug into one's body. Race/ethnicity data are presented only for non-Hispanic black, non-Hispanic white, and Hispanic students (who might be of any race); the numbers of students from other racial/ethnic groups were too small for meaningful analysis. Data were weighted to provide national estimates (3), and the statistical software used for all data analyses accounted for the complex sample design. Temporal changes were analyzed using logistic regression analyses, which controlled for sex, race/ethnicity, and grade and simultaneously assessed significant (p<0.05) linear and quadratic time effects.† T-test analyses were used to test for significant (p<0.05) differences between results from 2005 and 2007. During 1991--2007, the prevalence of sexual experience decreased 12% overall, from 54.1% to 47.8%. Logistic regression analyses indicated a significant linear decrease overall and among female, male, 9th-grade, 10th-grade, 11th-grade, 12th-grade, black, and white students (Table). Among Hispanic students, no significant change was detected. Among male students, 11th-grade students, and black students, a significant quadratic trend also was detected. Among male students and 11th-grade students, the prevalence of sexual experience declined during 1991--1997 and then leveled off during 1997--2007. Among black students, the prevalence of sexual experience declined during 1991--2001 and then leveled off during 2001--2007. From 2005 to 2007, no significant change was detected in the prevalence of sexual experience overall or among any sex, grade, or racial/ethnic subgroup of students. During 1991--2007, the prevalence of multiple sex partners decreased 20%, from 18.7% to 14.9%. A significant linear decrease was detected overall and among female, male, 9th-grade, 10th-grade, 11th-grade, 12th-grade, black, and white students (Table). Among Hispanic students, no significant change was detected. A significant quadratic trend also was detected among male students, 11th-grade students, and 12th-grade students. For each group, the prevalence of multiple sex partners declined during 1991--1997 and then leveled off during 1997--2007. From 2005 to 2007, no significant change was detected in the prevalence of multiple sex partners overall or among any sex, grade, or racial/ethnic subgroup of students. During 1991--2007, the prevalence of current sexual activity decreased 7%, from 37.5% to 35.0%. A significant linear decrease was detected overall and among 9th-grade students and black students (Table). Among 9th-grade and 11th-grade students, a significant quadratic trend was detected. For 9th-grade students, the prevalence of current sexual activity remained stable during 1991--1999 and then declined during 1999--2007. For 11th-grade students, the prevalence of current sexual activity declined during 1991--1999 and then remained stable during 1999--2007. From 2005 to 2007, no significant change was detected in the prevalence of current sexual activity overall or among any sex, grade, or racial/ethnic subgroup of students. During 1991--2007, among students who were currently sexually active, the prevalence of condom use increased 33%, from 46.2% to 61.5%. A significant linear increase in condom use was detected among currently sexually active students overall and among all sex, grade, and racial/ethnic subgroups of students who were currently sexually active. A significant quadratic trend also was detected among currently sexually active students overall and among female students, 10th-grade students, and black students who were currently sexually active. Among currently sexually active students overall, female students, and 10th-grade students, the prevalence of condom use increased during 1991--2003 and then leveled off during 2003--2007. The prevalence of condom use among currently sexually active black students increased during 1991--1999 and then leveled off during 1999--2007. From 2005 to 2007, no significant change was detected in the prevalence of condom use overall or among any sex, grade, or racial/ethnic subgroup of currently sexually active students. During 1995--2007, the prevalence of injection-drug use remained below 4%. However, a significant linear increase in injection-drug use was detected among black and Hispanic students. From 2005 to 2007, no change was detected in the prevalence of injection-drug use overall or among any subgroup, except for 10th-grade students, whose prevalence decreased from 2.3% to 1.4%. Reported by: A Balaji, PhD, R Lowry, MD, N Brener, PhD, L Kann, PhD, L Romero, DrPH, H Wechsler, EdD, Div of Adolescent and School Health, National Center for Chronic Disease Prevention and Health Promotion, CDC. Editorial Note:A Healthy People 2010 national health objective (no. 25-11) is to increase to 95% the proportion of adolescents in grades 9--12 who abstain from sexual intercourse or use condoms if currently sexually active (2). CDC reported previously that, in 2007, 87% of high school students reported abstaining from sexual intercourse or using condoms if currently sexually active (4), compared with 80% in 1991. Despite this progress, the analyses in this report indicate that no changes were detected in the prevalence of sexual risk behaviors from 2005 to 2007, and some subgroups did not experience the overall changes observed during 1991--2007. For example, among black students, the prevalence of sexual experience, multiple sex partners, and current sexual activity remained higher than among any other subgroup of high school students, the prevalence of sexual experience did not decrease during 2001--2007, and the prevalence of condom use did not increase during 1999--2007. Among Hispanic students, the prevalence of sexual experience, multiple sex partners, and current sexual activity did not change during 1991--2007. Among male students, the prevalence of sexual experience and multiple sex partners did not decrease after 1997, and current sexual activity did not change during 1991--2007. Therefore, renewed efforts to delay onset of sexual activity and increase condom use among students who are sexually active are warranted, especially among black, Hispanic, and male students. The findings in this report are subject to at least two limitations. First, these data apply only to youths who attend school and therefore are not representative of all persons in this age group. In 2005, of persons aged 16--17 years in the United States, approximately 3% were not enrolled in a high school program and had not completed high school (5). Second, the extent of underreporting or overreporting of behaviors cannot be determined, although the survey questions demonstrated good test-retest reliability (6). The lack of recent change in the prevalence of HIV- and STD-related risk behaviors among high school students might have contributed to recent increases in related health outcomes. For example, during 2003--2006, in the 33 states with confidential, name-based HIV infection reporting, the estimated annual number of HIV/acquired immunodeficiency syndrome cases diagnosed among adolescents aged 15--19 increased 34%, from 993 in 2003 to 1,332 in 2006 (7). Similarly, after decreasing annually since 1999, gonorrhea infection rates among adolescents aged 15--19 years increased 2% from 2004 to 2005, from 421.9 to 431.8 per 100,000, and then increased 6% from 2005 to 2006, from 431.8 to 458.8 per 100,000 (8). Also, birth rates among adolescents aged 15--19 years decreased annually during 1991--2005 and then increased for the first time during 2005--2006, from 40.5 live births per 1,000 females in 2005 to 41.9 in 2006 (9). Programs and activities aimed at addressing these health outcomes should involve parents and families, schools, youth-serving organizations, health-care providers, the media, government agencies, and youths themselves. References
* The YRBS questions were as follows: "Have you ever had sexual intercourse?" "During your life, with how many people have you had sexual intercourse?" "During the past 3 months, with how many people did you have sexual intercourse?" "The last time you had sexual intercourse, did you or your partner use a condom?" and "During your life, how many times have you used a needle to inject any illegal drug into your body?" The wording of the question on injection-drug use changed substantially after the 1993 survey, so 1991 and 1993 data on injection-drug use are not included in this report. † A quadratic trend indicates a significant but nonlinear trend in the data over time; whereas a linear trend is depicted with a straight line, a quadratic trend is depicted with a curve with one bend. Trends that include significant quadratic and linear components demonstrate nonlinear variation in addition to an overall increase or decrease over time.
All MMWR HTML versions of articles are electronic conversions from typeset documents. This conversion might result in character translation or format errors in the HTML version. Users are referred to the electronic PDF version (http://www.cdc.gov/mmwr) and/or the original MMWR paper copy for printable versions of official text, figures, and tables. An original paper copy of this issue can be obtained from the Superintendent of Documents, U.S. Government Printing Office (GPO), Washington, DC 20402-9371; telephone: (202) 512-1800. Contact GPO for current prices. **Questions or messages regarding errors in formatting should be addressed to mmwrq@cdc.gov.Date last reviewed: 7/30/2008 |
|||||||||
|