 |
|
|
|
|
|
|
| ||||||||||
|
|
|
|
|
|
|
||||
| ||||||||||
|
|
|
|
|
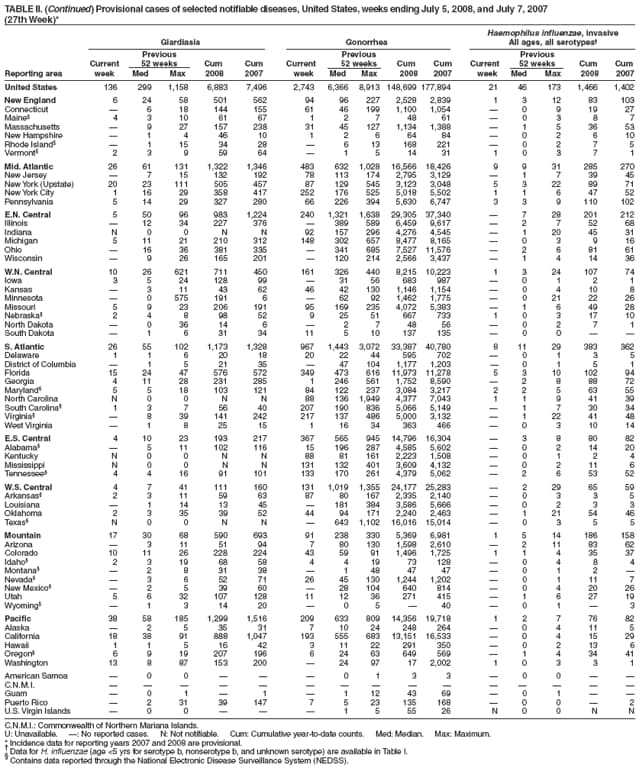
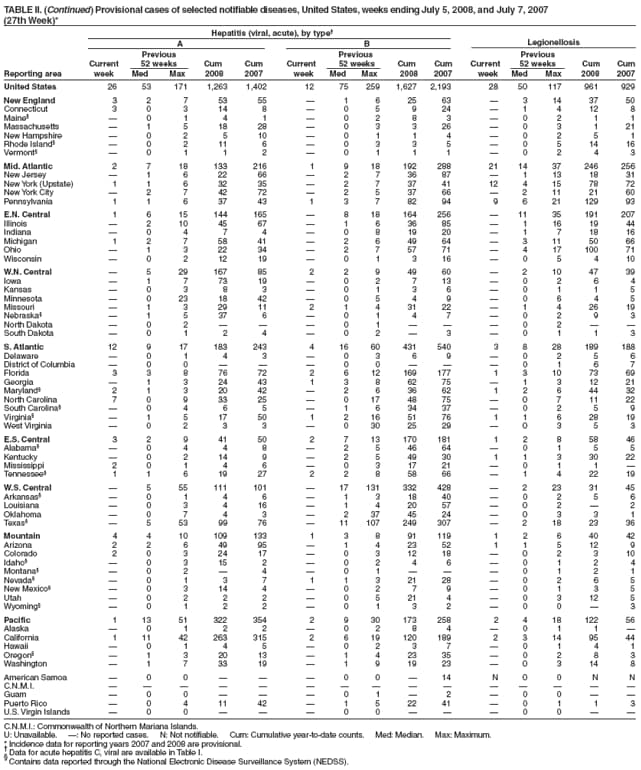
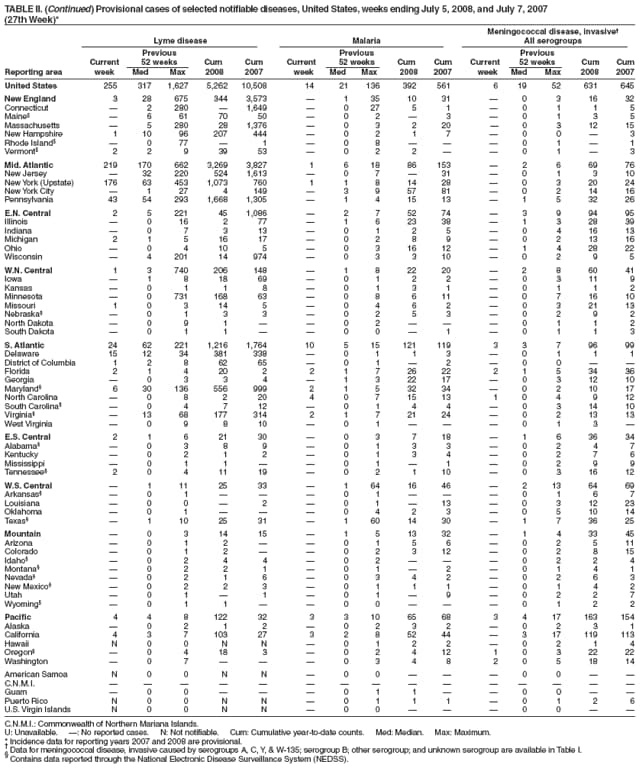
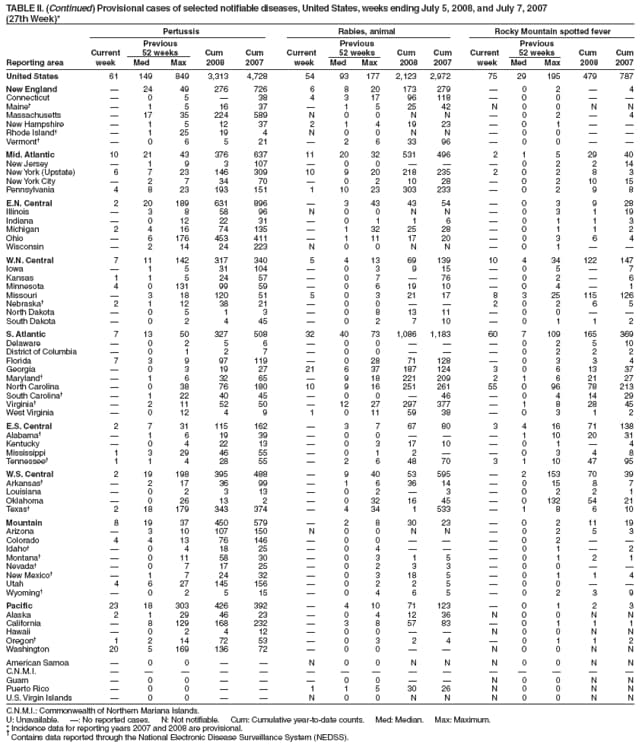
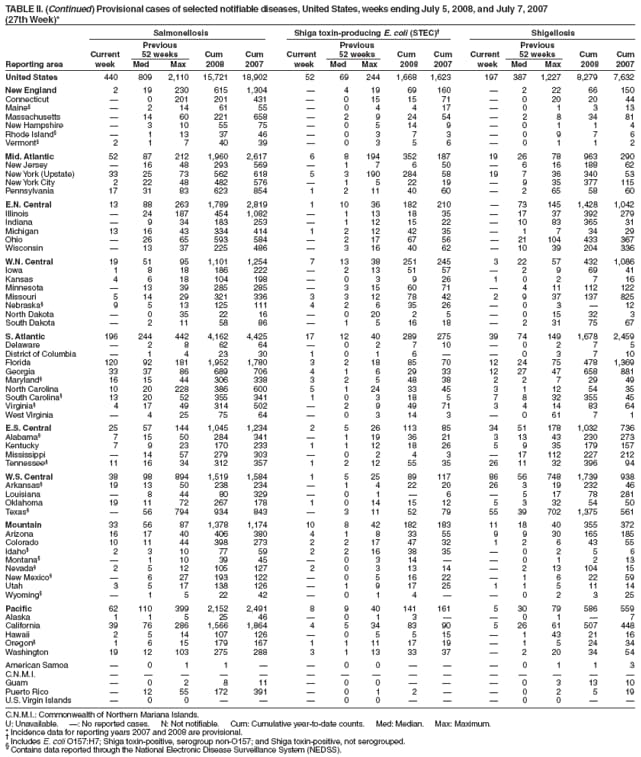
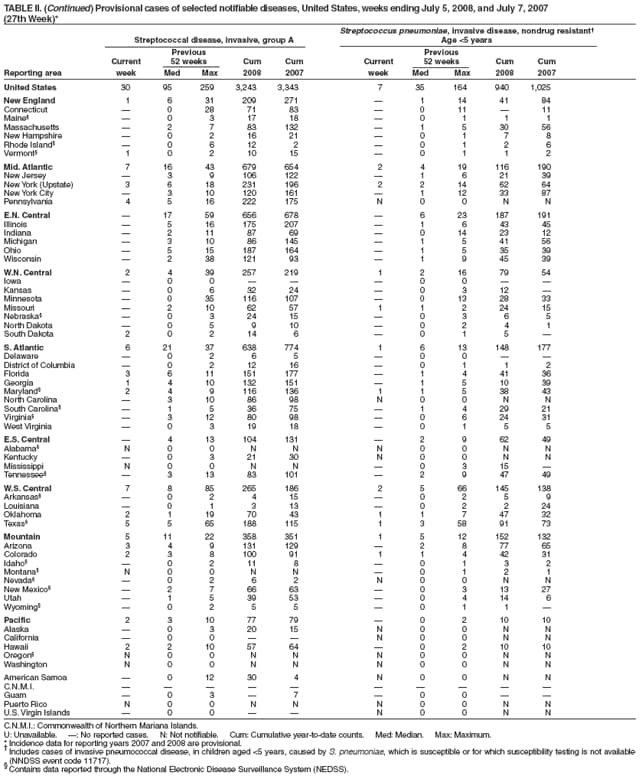
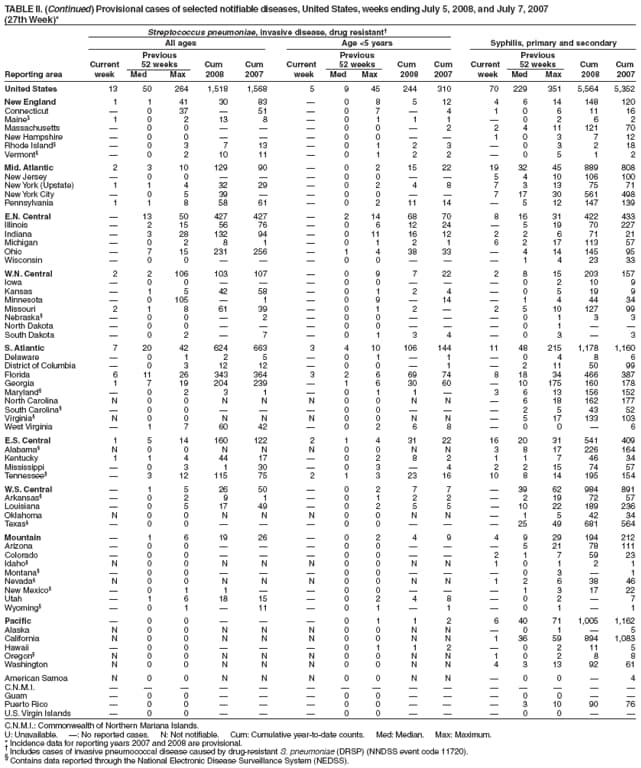
Persons using assistive technology might not be able to fully access information in this file. For assistance, please send e-mail to: mmwrq@cdc.gov. Type 508 Accommodation and the title of the report in the subject line of e-mail. Notifiable Diseases/Deaths in Selected Cities Weekly InformationFigure I Selected notifiable disease reports, United States, comparison of provisional 4-week totals ending July 5, 2008, with historical data Table I Summary of provisional cases of selected notifiable diseases, United States, cumulative, week ending July 5, 2008 (27th Week) Table II Provisional cases of selected notifiable diseases, United States, weeks ending July 5, 2008 and July 7, 2007 (27th Week) Table III Deaths in 122 U.S. cities, week ending July 5, 2008 (27th Week) Table IV Provisional cases of selected notifiable diseases,* United States, quarter ending June 28, 2008 (26th Week) Figure I  Return to top. Table I 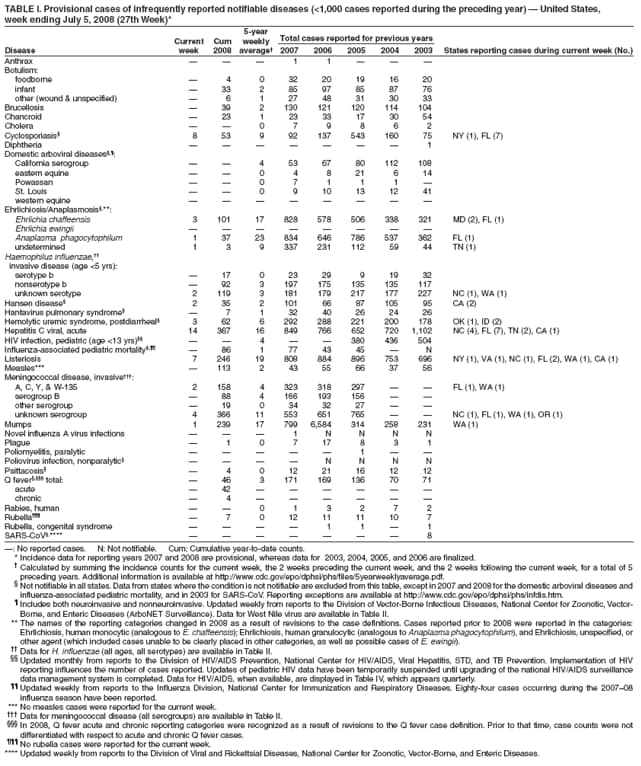 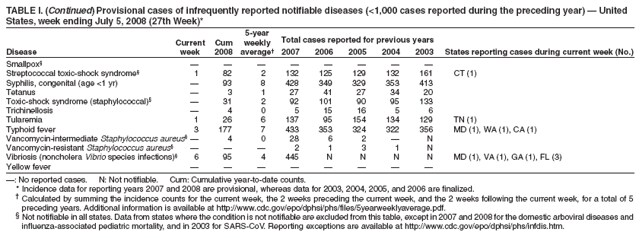 Return to top. Table II 
 Return to top. Table III 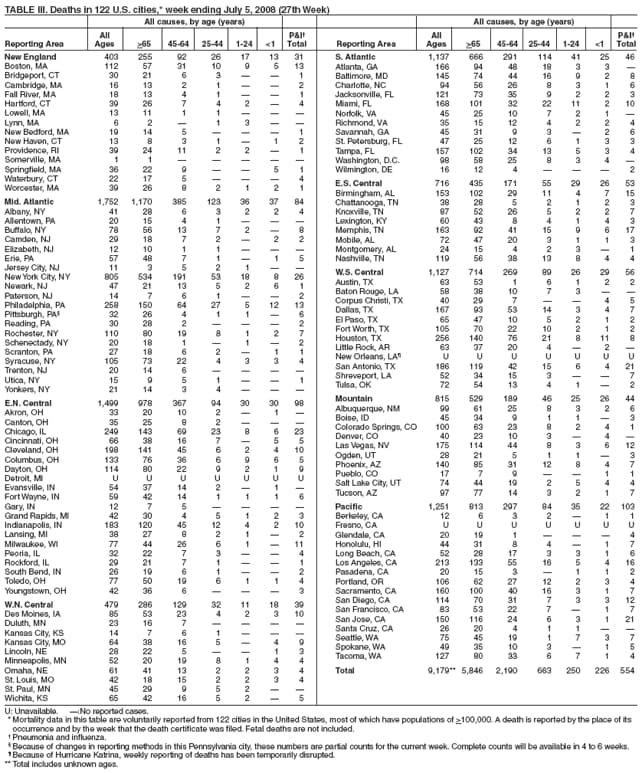 Return to top. Table IV  Return to top. All MMWR HTML versions of articles are electronic conversions from typeset documents.
This conversion might result in character translation or format errors in the HTML version.
Users are referred to the electronic PDF version (http://www.cdc.gov/mmwr)
and/or the original MMWR paper copy for printable versions of official text, figures, and tables.
An original paper copy of this issue can be obtained from the Superintendent of Documents, U.S.
Government Printing Office (GPO), Washington, DC 20402-9371;
telephone: (202) 512-1800. Contact GPO for current prices. Date last reviewed: 7/9/2008 |
|||||||||
|