 |
|
|
|
|
|
|
| ||||||||||
|
|
|
|
|
|
|
||||
| ||||||||||
|
|
|
|
|
Persons using assistive technology might not be able to fully access information in this file. For assistance, please send e-mail to: mmwrq@cdc.gov. Type 508 Accommodation and the title of the report in the subject line of e-mail. Influenza Activity --- United States and Worldwide, 2007--08 SeasonDuring the 2007--08 influenza season, influenza activity* peaked in mid-February in the United States and was associated with greater mortality and higher rates of hospitalization of children aged 0--4 years, compared with each of the previous three seasons. In the United States, influenza A (H1N1) was the predominant strain early in the season; influenza A (H3N2) viruses increased in circulation in January and predominated overall. While influenza A (H1N1), A (H3N2), and B viruses cocirculated worldwide, influenza A (H1N1) viruses were most commonly reported in Canada, Europe, and Africa, and influenza B viruses were predominant in most Asian countries. This report summarizes influenza activity in the United States and worldwide during the 2007--08 influenza season (September 30, 2007--May 17, 2008). Overview of Influenza Activity in the United StatesThe national percentage of respiratory specimens that tested positive for influenza peaked in early to mid-February, and the proportion of outpatient visits to sentinel providers for influenza-like illness (ILI)† and to BioSense§ Department of Veteran's Affairs (VA) and Department of Defense (DoD) outpatient clinics for acute respiratory illness (ARI)¶ peaked in mid-February. Viral SurveillanceDuring September 30, 2007--May 17, 2008,** World Health Organization and National Respiratory and Enteric Virus Surveillance System collaborating laboratories in the United States tested 225,329 specimens for influenza viruses; 39,827 (18%) were positive (Figure 1). Of the positive specimens, 28,263 (71%) were influenza A viruses, and 11,564 (29%) were influenza B viruses. Among the influenza A viruses, 8,290 (29%) were subtyped; 2,175 (26%) were influenza A (H1N1), and 6,115 (74%) were influenza A (H3N2) viruses. The proportion of specimens testing positive for influenza first exceeded 10% during the week ending January 12, 2008 (week 2), peaked at 32% during the week ending February 9, 2008 (week 6), and declined to <10% during the week ending April 19, 2008 (week 16). The proportion positive was above 10% for 14 consecutive weeks. The peak percentage of specimens testing positive for influenza during the previous three seasons ranged from 22% to 34% and the peak occurred during mid-February to early March (1). During the previous three influenza seasons, the number of consecutive weeks during which more than 10% of specimens tested positive for influenza ranged from 13 to 17 weeks (1). During the 2007--08 influenza season, more influenza A viruses than influenza B viruses were identified in all surveillance regions;†† however, the predominant influenza A virus varied by region. Influenza A (H1N1) was most commonly reported in two of the nine surveillance regions (Mountain and Pacific), and influenza A (H3N2) was most commonly reported in the remaining seven surveillance regions (East North Central, East South Central, Mid-Atlantic, New England, South Atlantic, West North Central, and West South Central). Antigenic CharacterizationSince September 30, 2007, CDC has antigenically characterized 1,161 influenza viruses collected by U.S. laboratories: 407 influenza A (H1N1) viruses, 404 influenza A (H3N2) viruses, and 350 influenza B viruses. Of the 407 influenza A (H1N1) viruses, 270 (66%) were characterized as antigenically similar to A/Solomon Islands/3/2006, the influenza A (H1N1) component of the 2007--08 Northern Hemisphere influenza vaccine. One hundred sixteen (29%) viruses were characterized as A/Brisbane/59/2007-like. Of the 404 influenza A (H3N2) viruses, 91 (23%) were characterized as similar to A/Wisconsin/67/2005, the influenza A (H3N2) component of the 2007--08 Northern Hemisphere influenza vaccine. Two hundred forty-three (60%) viruses were characterized as A/Brisbane/10/2007-like. Influenza B viruses currently circulating can be divided into two antigenically distinct lineages represented by B/Victoria/02/87 and B/Yamagata/16/88 viruses. Of the 350 influenza B viruses characterized, 342 (98%) were identified as belonging to the B/Yamagata lineage, and 304 (89%) of these viruses were similar to B/Florida/4/2006. The remaining eight (2%) of the 350 influenza B viruses characterized belong to the B/Victoria lineage; of these, six (75%) were similar to B/Ohio/01/2005, an antigenic equivalent to B/Malaysia/2506/2004, the influenza B component for the 2007--08 Northern Hemisphere influenza vaccine. Resistance to Antiviral MedicationsIn the United States, two classes of antiviral drugs are approved by the Food and Drug Administration for use in treating or preventing influenza virus infections: neuraminidase inhibitors (oseltamivir and zanamivir) and adamantanes (amantadine and rimantidine). During the 2007--08 influenza season, a small increase in the number of influenza viruses resistant to the neuraminidase inhibitor oseltamivir was observed. All of the oseltamivir-resistant viruses were influenza A (H1N1) isolates that shared a single genetic mutation (H274Y, N2 neuraminidase molecule numbering) (2) that confers oseltamivir resistance. Among specimens collected since October 1, 2007, 111 (10.9%) of the 1,020 influenza A (H1N1) viruses tested were found to be resistant to oseltamivir, an increase from four (0.7%) of 588 influenza A (H1N1) viruses tested during the 2006--07 season. No resistance to oseltamivir was identified among the 444 influenza A (H3N2) or 305 influenza B viruses tested. All tested viruses were sensitive to zanamivir. Adamantane resistance continues to be high among influenza A (H3N2) viruses with 524 (99.8%) of 525 influenza A (H3N2) viruses tested being resistant to the adamantanes. Adamantane resistance among influenza A (H1N1) viruses has been detected at a lower level. Of the 918 influenza A (H1N1) viruses tested, 98 (10.7%) were resistant to the adamantanes. None of the oseltamivir-resistant influenza A (H1N1) viruses identified during the 2007--08 season were resistant to adamantanes. Outpatient Illness SurveillanceThe weekly percentage of patient visits to U.S. sentinel providers for ILI met or exceeded national baseline levels§§ (2.2%) during the weeks ending December 29, 2007--March 22, 2008 (weeks 52--12) and peaked at 6.0% for the week ending February 23, 2008 (week 7) (Figure 2). During the previous three influenza seasons, the peak percentage of patient visits for ILI ranged from 3.2% to 5.4% and occurred during mid-February to early March (1). The weekly percentage of visits to VA and DoD BioSense outpatient clinics for ARI was at or above national baseline levels¶¶ (3.2%) during the weeks ending December 29, 2007--January 5, 2008 (weeks 52--1), and February 2--March 1, 2008 (weeks 5--9). Outpatient clinic visits for ARI peaked twice, once at 3.7% during the week ending December 29, 2007 (week 52), and again at 3.7% for the week ending February 23, 2008 (week 8). During the previous three influenza seasons, the peak percentage of patient visits for ARI has ranged from 3.4% to 4.5% and occurred during mid- to late February. The increase in the percentage of visits for ILI and ARI during the week ending December 29, 2007 (week 52) might have been influenced by a reduction in routine health-care visits during the holiday season, as has occurred during previous seasons. State-Specific Activity LevelsState and territorial epidemiologists report the geographic distribution of influenza in their state through a weekly influenza activity code.*** The geographic distribution of influenza activity peaked during the weeks ending February 16 and February 23, 2008 (weeks 7 and 8), when 49 states reported widespread activity and one state reported regional activity. All 50 states reported widespread influenza activity for at least 2 weeks during the 2007--08 season. No state reported widespread influenza activity during the weeks ending April 26--May 17, 2008 (weeks 17--20). The peak number of states reporting widespread or regional activity during the previous three seasons has ranged from 41 to 48 states (1). Influenza-Associated Pediatric HospitalizationPediatric hospitalizations associated with laboratory-confirmed influenza infections are monitored in two population-based surveillance networks: the Emerging Infections Program (EIP) and the New Vaccine Surveillance Network (NVSN).††† During September 30, 2007--May 3, 2008, the preliminary influenza-associated hospitalization rate reported by EIP for children aged 0--17 years was 1.54 per 10,000. For children aged 0--4 years and 5--17 years, the rate was 4.03 per 10,000 and 0.55 per 10,000, respectively. During November 4, 2007--May 3, 2008, the preliminary laboratory-confirmed influenza-associated hospitalization rate for children aged 0--4 years in NVSN was 7.00 per 10,000. Rate estimates are preliminary and are subject to change as data are finalized. The end-of-season hospitalization rate for NVSN in the previous three seasons ranged from 3.5 (2006--07) to 7.0 (2004--05) per 10,000 children aged 0--4 years. The end-of-season hospitalization rate for EIP in the previous three seasons ranged from 2.5 (2006--07) to 3.8 (2005--06) per 10,000 children aged 0--4 years. The end-of-season hospitalization rate for EIP in the previous three seasons ranged from 0.3 (2006--07) to 0.6 per (2004--05) per 10,000 children aged 5--17 years. Differences in rate estimates between the NVSN and EIP systems are likely the result of different case-finding methods, diagnostic tests used, and the populations monitored. Pneumonia- and Influenza-Related MortalityDuring the 2007--08 influenza season, the percentage of deaths attributed to pneumonia and influenza (P&I) exceeded the epidemic threshold§§§ for 19 consecutive weeks in the 122 Cities Mortality Reporting System during the weeks ending January 12--May 17, 2008 (weeks 2--20) (Figure 3). The percentage of P&I deaths peaked at 9.1% during the week ending March 15, 2008 (week 11). During the previous three influenza seasons, the peak percentage of P&I deaths has ranged from 7.7% to 8.9% and the total number of weeks the P&I ratio exceeded the epidemic threshold has ranged from one to 11 (1). The P&I baseline and epidemic threshold values are projected for each season at the onset of that season and are based on data from the previous 5 years. Because three of the five seasons used to calculate baseline and epidemic threshold values for the 2007--08 season were mild, failure of the percentage of P&I deaths to return to baseline levels by the end of the 2007--08 season might have resulted from lowering of the baseline values or from changes occurring in the 122 Cities Mortality data as reporting sites apply newer data management methods. Influenza-Related Pediatric MortalityAs of June 19, 2008, 83 deaths associated with influenza infections that occurred among children aged <18 years during the 2007--08 influenza season were reported to CDC. These deaths were reported from 33 states (Alaska, Arizona, Arkansas, California, Colorado, Connecticut, Florida, Georgia, Illinois, Indiana, Iowa, Maine, Maryland, Massachusetts, Michigan, Minnesota, Mississippi, Nevada, New Hampshire, New Jersey, New Mexico, New York, North Carolina, Ohio, Oklahoma, Oregon, Pennsylvania, Tennessee, Texas, Utah, Vermont, Washington, and Wisconsin). All patients had laboratory-confirmed influenza virus infection. Among the 83 cases, the mean and median age was 6.4 years and 5.0 years, respectively; nine children were aged <6 months, 15 were aged 6--23 months, 11 were aged 2--4 years, and 48 were aged 5--17 years. Of the 79 cases for which the influenza virus type was known, 51 were influenza A viruses, 27 were influenza B viruses, and one had co-infection with influenza A and B viruses. Of the 63 cases aged >6 months for whom vaccination status was known, 58 (92%) had not been vaccinated against influenza according to the 2007 Advisory Committee on Immunization Practices (ACIP) recommendations (3). These data are provisional and subject to change as more information becomes available. Overview of Influenza Activity WorldwideDuring the 2007--08 influenza season, influenza A (H1N1), A (H3N2), and B viruses cocirculated worldwide. Influenza A viruses were more commonly reported in Canada and Europe, with influenza A (H1N1) viruses more common than influenza A (H3N2) viruses, while in Africa, small numbers of influenza A and B viruses were reported. In Asia, influenza A (H1N1) and influenza A (H3N2) viruses circulated at lower levels than influenza B, which predominated in most Asian countries. Although influenza A (H1N1) was most commonly reported during the season overall in Europe, influenza B viruses circulated at high levels, and predominated circulation for the season overall in some countries. Additional information on global influenza circulation is available at http://www.who.int/csr/disease/influenza/influenzanetwork/en/index.html. Reported by: WHO Collaborating Center for Surveillance, Epidemiology, and Control of Influenza. S Epperson, MPH, L Blanton, MPH, R Dhara, MPH, L Brammer, MPH, L Finelli, DrPH, M Okomo-Adhiambo, PhD, L Gubareva, PhD, T Wallis, MS, X Xu, MD, J Bresee, MD, A Klimov, PhD, N Cox, PhD, Influenza Div, National Center for Immunization and Respiratory Diseases, CDC. Editorial Note:During the 2007--08 season, influenza activity in the United States peaked in mid-February. In comparison with the previous three seasons, the most recent season had a severity similar to the 2004--05 influenza season, as determined by the percentage of deaths resulting from pneumonia and influenza, pediatric hospitalization rates, and the percentage of visits to outpatient clinics for ILI. In the United States, influenza A (H1N1), A (H3N2), and B viruses cocirculated throughout the season. The predominant virus varied by week, but influenza A (H3N2) viruses were most commonly reported for the season overall. Early in the season, from October to mid-January, influenza A (H1N1) was the most commonly reported subtype. Influenza A (H3N2) viruses were identified most frequently during the peak of the season from late January to mid-March. In the latter part of the season, from late March through May, when overall activity was declining, more influenza B than influenza A viruses were reported. In the United States, the majority of influenza A (H3N2) and influenza B viruses sent to CDC for further antigenic characterization were not matched optimally to the 2007--08 Northern Hemisphere influenza vaccine strains, while the majority of influenza A (H1N1) viruses were similar to the vaccine strain. Interim results from a study carried out this season with the Marshfield Clinic in Wisconsin found an overall vaccine effectiveness of 44%, with 58% effectiveness against the predominant influenza A (H3N2) viruses, but no effectiveness against influenza B (4). These preliminary results indicate that vaccination provided substantial protection against influenza in the study population, even though circulating strains were antigenically distinct from vaccine strains. These results are consistent with studies conducted during previous influenza seasons indicating that vaccination provides measureable protection against laboratory-confirmed influenza, even when vaccine strains are not matched optimally to circulating strains (5). Although influenza activity in the United States during the summer months is typically low, isolated cases and sporadic outbreaks of influenza, including sporadic cases of human infection with swine influenza, can occur during the summer. Public health laboratories are requested to submit summer isolates and any samples that cannot be subtyped by standard methods, or isolates that are otherwise unusual, to CDC for further antigenic characterization for influenza vaccine strain selection, antiviral resistance monitoring, and identification of novel influenza A viruses. CDC released two Health Alert Network health advisories during the 2007--08 influenza season. The first, published in January 2008, contained updated information regarding the occurrence of influenza and bacterial coinfections in cases reported through the Pediatric Influenza-Associated Mortality Surveillance System (6). The increase in the number of pediatric influenza-associated deaths reported with Staphylococcus aureus coinfection was reported first during the 2006--07 season (7), and this advisory provided further testing and treatment information for health-care providers, and guidelines for health departments investigating such cases (8). The second advisory, issued in February 2008, reported an increase in the number of influenza A (H1N1) viruses resistant to the influenza antiviral drug oseltamivir and summarized availability and use of alternative influenza antiviral medications. As a supplement to influenza vaccination, antiviral drugs are important adjuncts in the control and prevention of influenza. CDC continues to recommend use of oseltamivir and zanamivir for the treatment or prevention of influenza. This recommendation is based on the low level of oseltamivir resistance observed in only one influenza subtype, influenza A (H1N1), the persistence of high levels of resistance to the adamantanes in influenza A (H3N2) viruses, and the predominance of influenza A (H3N2) viruses circulating in the United States during the 2007--08 season with co-circulation of influenza B viruses. Use of amantadine or rimantidine is not recommended. CDC will continue to monitor the prevalence of antiviral resistance in the United States. In February 2008, ACIP voted to expand influenza vaccination recommendations to include all children aged 5--18 years, beginning with the 2008--09 influenza season, if feasible, but no later than the 2009--10 influenza season. The influenza vaccine supply is projected to be abundant for the upcoming influenza season in the United States with ample doses available for implementation of the new pediatric influenza vaccination recommendation. Continued efforts, however, are needed to improve influenza vaccination coverage among children aged 6 months through 4 years, an age group at high risk for influenza-related complications and hospitalization, and close contacts of all children aged <5 years (9,10). Vaccination of household contacts of children aged <6 months is particularly important because children aged <6 months are the pediatric group at highest risk for influenza complications, but no vaccine is available for this age group. High rates of laboratory confirmed influenza-associated hospitalization reported from the two population-based surveillance systems for children aged 0--4 years, and the low vaccination rate among influenza-associated pediatric deaths reported to CDC, highlight the increased risk for influenza-related complications and hospitalizations in young children, and the need to improve vaccine coverage in this age group. Health-care providers should offer vaccination, whether individually or through mass campaigns, soon after 2008--09 vaccine is available. All children aged 6 months through 8 years who previously have not received influenza vaccine should have their first dose administered as soon as vaccine is available to allow time for a second dose before or shortly after the onset of influenza activity in their community. Influenza activity in the United States rarely peaks before November, and activity has peaked in January or later in 20 (80%) of the previous 25 influenza seasons. Thus, vaccine administered in December or later is likely to be beneficial during most influenza seasons. Additional information regarding influenza viruses, influenza surveillance, avian influenza, and influenza vaccination recommendations is available at http://www.cdc.gov/flu. Acknowledgments This report is based, in part, on data contributed by participating state and territorial health departments and state public health laboratories, World Health Organization collaborating laboratories, National Respiratory and Enteric Virus Surveillance System collaborating laboratories, the U.S. Influenza Sentinel Provider Surveillance Network, the U.S. Department of Veteran's Affairs/U.S. Department of Defense BioSense Outpatient Surveillance System, the New Vaccine Surveillance Network, the Emerging Infections Program, and the 122 Cities Mortality Reporting System. References
* The CDC influenza surveillance system collects five categories of information from 10 data sources. Viral surveillance: U.S. World Health Organization collaborating laboratories, the National Respiratory and Enteric Virus Surveillance System, and novel influenza A virus case reporting. Outpatient illness surveillance: U.S. Influenza Sentinel Provider Surveillance Network and the U.S. Department of Veterans Affairs/U.S. Department of Defense BioSense Outpatient Surveillance System. Mortality: 122 Cities Mortality Reporting System and influenza-associated pediatric mortality reports. Hospitalizations: Emerging Infections Program and New Vaccine Surveillance Network. Summary of geographic spread of influenza: state and territorial epidemiologist reports. † Defined as a temperature of >100.0°F (>37.8°C), oral or equivalent, and cough and/or sore throat, in the absence of a known cause other than influenza. § BioSense is a national surveillance system that receives, analyzes, and evaluates health data from multiple sources, including 1) approximately 1,150 VA/DoD hospitals and ambulatory-care clinics; 2) multihospital systems, local hospitals, and state and regional syndromic surveillance systems in 37 states; and 3) Laboratory Corporation of America (LabCorp) test results. ¶ Based on International Classification of Diseases, Ninth Revision codes for ARI: 460-66 and 480-88. ** Data as of June 19, 2008. †† Surveillance regions: New England (Connecticut, Maine, Massachusetts, New Hampshire, Rhode Island, Vermont); Mid-Atlantic (New Jersey, New York, Pennsylvania); East North Central (Illinois, Indiana, Michigan, Ohio, Wisconsin); West North Central (Iowa, Kansas, Minnesota, Missouri, Nebraska, North Dakota, South Dakota); South Atlantic (Delaware, District of Columbia, Florida, Georgia, Maryland, North Carolina, South Carolina, Virginia, West Virginia); East South Central (Alabama, Kentucky, Mississippi, Tennessee); West South Central (Arkansas, Louisiana, Oklahoma, Texas); Mountain (Arizona, Colorado, Idaho, Montana, Nevada, New Mexico, Utah, Wyoming); Pacific (Alaska, California, Hawaii, Oregon, Washington). §§ The national and regional baselines are the mean percentage of visits for ILI during noninfluenza weeks for the previous three seasons plus two standard deviations. A noninfluenza week is a week during which <10% of specimens tested positive for influenza. National and regional percentages of patient visits for ILI are weighted on the bases of state population. Use of the national baseline for regional data is not appropriate. ¶¶ The national, regional, and age-specific baselines are the mean percentage of visits for ARI during noninfluenza weeks for the previous three seasons plus two standard deviations. A noninfluenza week is a week during which <10% of specimens tested positive for influenza. Use of national baseline for regional data is not appropriate. *** Levels of activity are 1) no activity; 2) sporadic: isolated laboratory-confirmed influenza cases or a laboratory-confirmed outbreak in one institution, with no increase in ILI activity; 3) local: increased ILI , or at least two institutional outbreaks (ILI or laboratory-confirmed influenza) in one region with recent laboratory evidence of influenza in that region; virus activity no greater than sporadic in other regions; 4) regional: increased ILI activity or institutional outbreaks (ILI or laboratory-confirmed influenza) in at least two but less than half of the regions in the state with recent laboratory evidence of influenza in those regions; and 5) widespread: increased ILI activity or institutional outbreaks (ILI or laboratory-confirmed influenza) in at least half the regions in the state with recent laboratory evidence of influenza in the state. ††† NVSN conducts surveillance in Monroe County, New York; Hamilton County, Ohio; and Davidson County, Tennessee. NVSN provides population-based estimates of laboratory-confirmed influenza hospitalization rates in children aged <5 years admitted to NVSN hospitals with fever or respiratory symptoms. Children are prospectively enrolled, and respiratory samples are collected and tested by viral culture and reverse transcription--polymerase chain reaction (RT-PCR). EIP conducts surveillance in 60 counties associated with 12 metropolitan areas: San Francisco, California; Denver, Colorado; New Haven, Connecticut; Atlanta, Georgia; Baltimore, Maryland; Minneapolis/St. Paul, Minnesota; Albuquerque, New Mexico; Las Cruces, New Mexico; Albany, New York; Rochester, New York; Portland, Oregon; and Nashville, Tennessee. EIP conducts surveillance for laboratory-confirmed, influenza-related hospitalizations in persons aged <18 years. Hospital laboratory and admission databases and infection-control logs are reviewed to identify children with a positive influenza test (i.e., viral culture, direct fluorescent antibody assays, RT-PCR, or a commercial rapid antigen test) from testing conducted as a part of their routine care. §§§ The expected seasonal baseline proportion of P&I deaths reported by the 122 Cities Mortality Reporting System is projected using a robust regression procedure in which a periodic regression model is applied to the observed percentage of deaths from P&I that occurred during the preceding 5 years. The epidemic threshold is 1.645 standard deviations above the seasonal baseline.
Figure 1 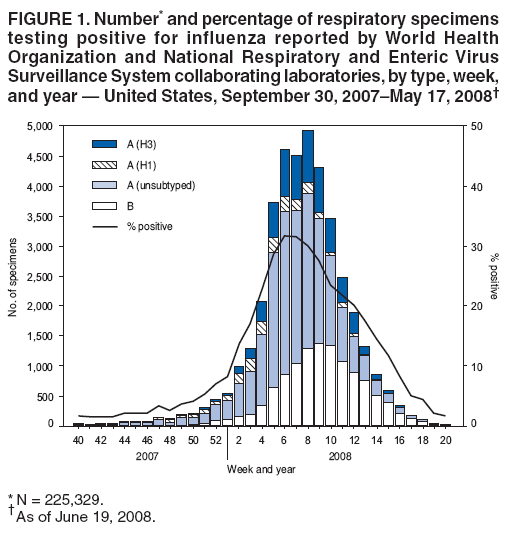 Return to top. Figure 2 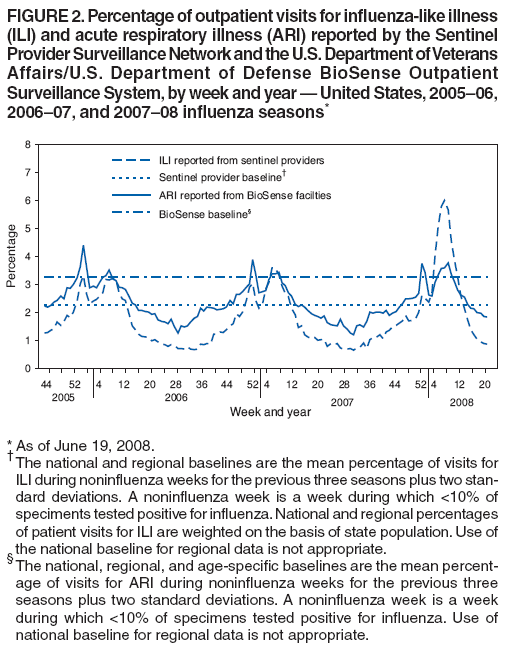 Return to top. Figure 3 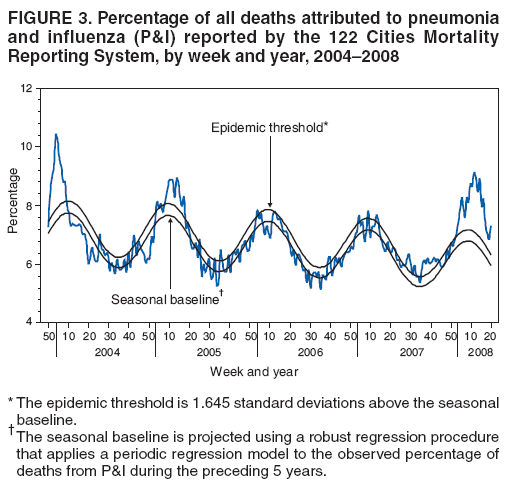 Return to top.
All MMWR HTML versions of articles are electronic conversions from typeset documents. This conversion might result in character translation or format errors in the HTML version. Users are referred to the electronic PDF version (http://www.cdc.gov/mmwr) and/or the original MMWR paper copy for printable versions of official text, figures, and tables. An original paper copy of this issue can be obtained from the Superintendent of Documents, U.S. Government Printing Office (GPO), Washington, DC 20402-9371; telephone: (202) 512-1800. Contact GPO for current prices. **Questions or messages regarding errors in formatting should be addressed to mmwrq@cdc.gov.Date last reviewed: 6/26/2008 |
|||||||||
|