|
|
|
|
|
|
|
| ||||||||||
|
|
|
|
|
|
|
||||
| ||||||||||
|
|
|
|
|
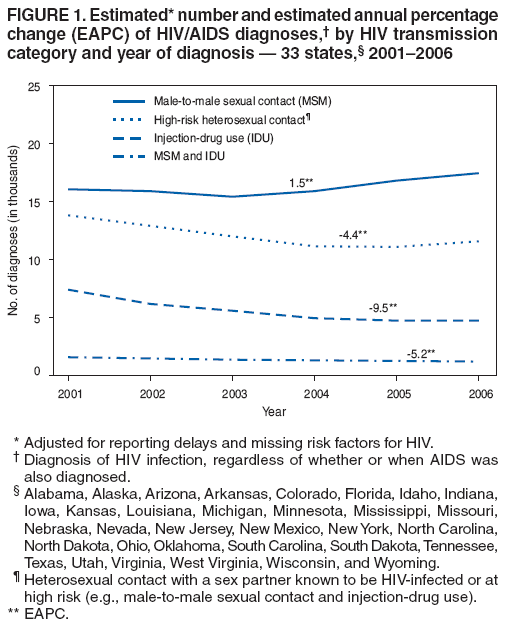
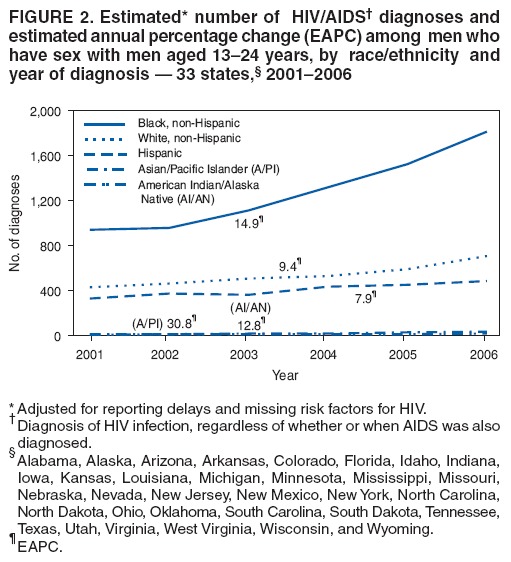
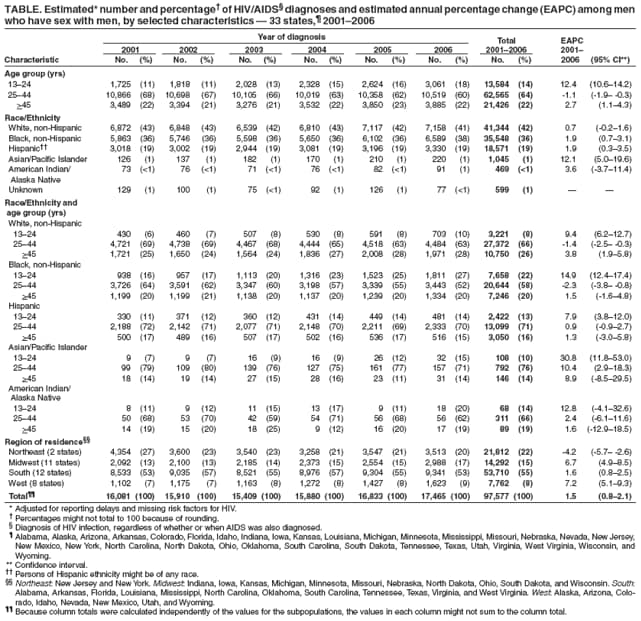
Persons using assistive technology might not be able to fully access information in this file. For assistance, please send e-mail to: mmwrq@cdc.gov. Type 508 Accommodation and the title of the report in the subject line of e-mail. Trends in HIV/AIDS Diagnoses Among Men Who Have Sex with Men --- 33 States, 2001--2006In 2008, CDC conducted an analysis of trends in diagnoses of human immunodeficiency virus/acquired immunodeficiency syndrome (HIV/AIDS) among men who have sex with men (MSM) in the 33 states* that have had confidential, name-based HIV case reporting since at least 2001. This report summarizes the results of that analysis, which indicated that the number of HIV/AIDS diagnoses among MSM overall during 2001--2006 increased 8.6% (estimated annual percentage change [EAPC] = 1.5). During 2001--2006, an estimated 214,379 persons had HIV/AIDS diagnosed in the 33 states. Of these diagnoses, 46% were in MSM, and 4% were in MSM who engaged in illicit injection-drug use (IDU) (i.e., MSM and IDU). To reduce the impact of HIV/AIDS in the United States, HIV prevention services that aim to reduce the risk for acquiring and transmitting infection among MSM and link infected MSM to treatment must be expanded. In this report, HIV/AIDS refers to three categories of diagnoses collectively: 1) a diagnosis of HIV infection (not AIDS), 2) a diagnosis of HIV infection with subsequent AIDS diagnosis, and 3) concurrent diagnoses of HIV infection and AIDS. Reporting cases of HIV infection (not AIDS) and AIDS is now legally mandated in all U.S. states, the District of Columbia, and five U.S. territories. The CDC case definition for HIV infection (not AIDS) requires a positive test result from an assay approved by the Food and Drug Administration that demonstrates evidence of HIV infection; the case definition for AIDS requires meeting the HIV infection (not AIDS) case definition, plus diagnosis of at least one AIDS-defining illness or a CD4+ T-lymphocyte count of <200 cells/µL.† Using the HIV/AIDS Reporting System (HARS), case report data were collected by local and state health department staff members and then transmitted to CDC devoid of patient names. The findings in this report are based on HIV/AIDS diagnoses made during 2001--2006 and reported to CDC as of June 30, 2007 (1). Numbers of diagnoses were adjusted for reporting delays and for redistribution of cases with missing risk factor information, using a standard method that has been described previously (2). This method does not include statistical adjustments for diagnosed but unreported cases or for cases yet to be diagnosed. To facilitate comparisons between the estimated number of diagnoses occurring in 2001 and the number occurring in 2006, 95% confidence intervals (CIs) were calculated. To examine trends, EAPCs with corresponding CIs were calculated. EAPC measures the differences between adjacent years under examination and then averages these inter-year differences. In this report, transmission categories§ are discrete (e.g., "MSM" is distinct from "MSM and IDU" and "IDU" is distinct from "MSM and IDU"). Accordingly, MSM who were also injection-drug users (MSM and IDU) were excluded from analysis of MSM. Of 214,379 HIV/AIDS diagnoses in 33 states during 2001--2006, a total of 97,577 (46%) were among MSM. Decreases in diagnoses were observed in all transmission categories except MSM (excluding MSM and IDU) (Figure 1). Among males, MSM accounted for 97,577 (63%) of cases. Men aged 25--44 years accounted for 64% of cases among MSM (Table). Among MSM, the number of diagnoses increased from 16,081 (CI = 15,784--16,377) in 2001 to 17,465 (CI = 16,938--17,992) in 2006; (EAPC = 1.5) (Figure 1). From 2001 to 2006, a 12.4% (EAPC = 1.9) increase in the number of HIV/AIDS diagnoses among all black MSM was observed; however, an increase of 93.1% (EAPC = 14.9) was observed among black MSM aged 13--24 years (Figure 2). During 2001--2006, approximately twice as many (7,658) diagnoses occurred in black MSM aged 13--24 years as in their white counterparts (3,221). The largest proportionate increase (255.6% [EAPC = 30.8]) was among Asian/Pacific Islander MSM aged 13--24 years. Among MSM aged 13--24 years, statistically significant increases in diagnoses as measured by EAPC were observed in all racial/ethnic populations except American Indian/Alaska Natives. Among MSM of all ages, statistically significant increases as measured by EAPC were observed in blacks, Hispanics, and Asian/Pacific Islanders.¶ Reported by: A Mitsch, MPH, X Hu, MS, K McDavid Harrison, PhD, T Durant, PhD, Div of HIV/AIDS Prevention, National Center for HIV/AIDS, Viral Hepatitis, STD, and TB Prevention, CDC. Editorial Note:During 2001--2006, male-to-male sex remained the largest HIV transmission category in the United States and the only one associated with an increasing number of HIV/AIDS diagnoses. In this analysis, statistically significant decreases in HIV/AIDS diagnoses were observed for all other transmission categories (i.e., among persons likely to have been infected through high-risk heterosexual contact, IDU, MSM and IDU, and other routes). Among MSM aged 13--24 years, statistically significant increases in diagnoses were observed in nearly all racial/ethnic populations. These findings underscore the need for continued effective testing and risk reduction interventions for MSM, particularly those aged <25 years. The data in this report indicate when persons were diagnosed with HIV infection, rather than when they became infected. This is an important distinction because a person might have been infected with HIV for years before receiving a diagnosis of HIV infection. Determining when persons who have been diagnosed were actually infected is difficult. Although HIV diagnosis data can provide some indication of underlying trends in HIV infection, this approach has limitations. A greater number of tests for HIV infection among MSM might partially explain the observed increase in HIV/AIDS diagnoses. However, available data suggest that these increases cannot be explained by increases in testing alone; the increase could be attributed to more targeted testing, increasing incidence, or some combination of these.** To improve the nation's ability to track new HIV infections, CDC has established a new system for measuring incident HIV infections at the population level. A novel laboratory method will be combined with standard case surveillance procedures and statistical estimations to provide a better means of estimating national HIV incidence from the number of persons who are newly diagnosed with HIV (3). This system will be able to distinguish between recent and long-standing HIV-1 infection on a population level. Estimates from the new system are expected to be available in 2008. The new system will provide a better tool for measuring progress in the prevention of HIV infection than data based on HIV/AIDS diagnoses alone, such as those described in this report. Nevertheless, diagnosis data will continue to play an important role in monitoring the HIV epidemic, particularly among adolescents and young adults who, because of their age, are unlikely to have been infected many years before diagnosis. Additionally, HIV/AIDS diagnosis data will continue to provide useful information for evaluating efforts to increase HIV testing and will allow programs that do not conduct HIV incidence surveillance to monitor the HIV epidemic in their local area. The findings in this report are subject to at least four limitations. First, the 33-state case surveillance data are not representative of all HIV-positive persons in the United States. However, the racial/ethnic disparities described in this report are similar to those observed in AIDS cases from all 50 states (4). Second, since 1993, the proportion of HIV/AIDS cases reported to CDC without an identified risk factor for HIV infection has been increasing. In 2006, no risk factor was reported for 25% of HIV (not AIDS) adult and adolescent cases reported to CDC (4). This results in an increasing proportion of cases that are assigned to transmission categories (including male-to-male sexual contact) not based on interview with patients, but rather via statistical adjustment. Risk factor information often is missing because patients decline to disclose behaviors that might place them at risk for HIV transmission or are unaware of their sex partners' high-risk behavior. Third, methods for reporting delay adjustments have greatest uncertainty for the most recent years' estimates of HIV/AIDS diagnoses; therefore, recent trends should be interpreted with caution. Finally, a backlog of cases diagnosed earlier than recorded in the data might have exaggerated the number of diagnoses in the first 2--3 years after name-based HIV (not AIDS) case reporting was implemented (5). For example, retrospective ascertainment of name-based HIV case reports might have resulted in a substantial number of cases that were recorded as diagnosed during 2001--2002 but were actually diagnosed earlier. New York's implementation of name-based HIV reporting in June 2000 might have magnified the effect of this backlog on the 33-state trend analysis because New York data represented 21% of all HIV/AIDS diagnoses during 2001--2006. After exclusion of New York from this analysis, however, an even larger statistically significant increase in HIV/AIDS diagnoses among MSM was observed during 2001--2006 (EAPC = 3.1 [CI = 2.4--3.9]). To reduce transmission of HIV among MSM of all races/ethnicities, prevention strategies should be strengthened, improved, and implemented more broadly. Testing is important in preventing HIV transmission because it provides knowledge of one's infection status; after persons become aware that they are HIV positive, most reduce their high-risk sexual behavior (6). In addition, an estimated 25% of HIV-infected persons have not received a diagnosis of HIV infection (7). These persons represent a challenge in terms of HIV prevention and case ascertainment. Moreover, testing is the first step to linking persons infected with HIV to medical care. CDC recommends at least annual testing for sexually active MSM and an "opt-out" approach for screening of all patients aged 13--64 years in clinical settings (8). Ulcerative and nonulcerative sexually transmitted diseases (STDs) such as syphilis and gonorrhea facilitate HIV transmission from infected MSM and acquisition of HIV by noninfected MSM; therefore, screening for STDs in private and public clinical settings is an important component of HIV prevention in MSM (9). STD and HIV prevention efforts should be as fully integrated as possible. Furthermore, associations have been observed between abuse of illicit and legal drugs such as methamphetamine and alcohol, respectively, and high-risk behavior among MSM. Screening for substance abuse in private and public clinical settings is an important tool for reducing HIV transmission.†† Strengthened collaborations between STD, HIV, viral hepatitis, and substance abuse programs should result in more effective HIV prevention efforts. CDC assists in the creation, development, and dissemination of behavioral interventions for the MSM population. Recently, in collaboration with the state health department and local organizations in North Carolina, CDC implemented a successful intervention for young black MSM (10). This intervention has resulted in decreases in high-risk sexual behavior and the number of sex partners with whom such behavior occurred. CDC recommends that state and local health departments allocate HIV prevention resources to ensure that program operations reflect the current state of the HIV/AIDS epidemic in the geographic areas for which each health department is responsible. In support of CDC's strategic goal of reducing the number of new HIV infections in the United States,§§ the proportion of MSM who adopt behaviors that reduce risk for HIV transmission must increase. References
* Alabama, Alaska, Arizona, Arkansas, Colorado, Florida, Idaho, Indiana, Iowa, Kansas, Louisiana, Michigan, Minnesota, Mississippi, Missouri, Nebraska, Nevada, New Jersey, New Mexico, New York, North Carolina, North Dakota, Ohio, Oklahoma, South Carolina, South Dakota, Tennessee, Texas, Utah, Virginia, West Virginia, Wisconsin, and Wyoming. † The AIDS case definition immunologic criteria may be satisfied alternatively by a CD4+ T-lymphocyte percentage of total lymphocytes of less than 14%. § Transmission categories are 1) male-to-male sexual contact (i.e., MSM), 2) IDU, 3) MSM and IDU, 4) high-risk heterosexual contact (i.e., with a person of the opposite sex known to be HIV infected or at high risk for HIV/AIDS [e.g., an MSM or injection-drug user]), and 5) other (e.g., hemophilia or blood transfusion) and all risk factors not reported or not identified. ¶ Because of small numbers of Asian/Pacific Islander MSM and the resultant wide CIs around point estimates, the rate of increase in this subpopulation should be interpreted with caution. ** Prosser AT. Comparison of HIV diagnoses and HIV tests among MSM aged 15--24, 2001--2004---12 states. Presented at the 2007 National HIV Prevention Conference (session B15-5), Atlanta, GA; December 2007. Available at http://www.cdcnpin.org/2007_national_hiv_prev_conf/public/viewdocument.aspx?documentid=9f078036-e3e5-41fe-8086-f99f0b2fe3d2. †† Additional information available at http://www.drugabuse.gov/pdf/infofacts/drugsaids06.pdf. §§ Additional information available at http://www.cdc.gov/hiv/resources/reports/psp/goal_objective.htm.
Figure 1
All MMWR HTML versions of articles are electronic conversions from typeset documents. This conversion might result in character translation or format errors in the HTML version. Users are referred to the electronic PDF version (http://www.cdc.gov/mmwr) and/or the original MMWR paper copy for printable versions of official text, figures, and tables. An original paper copy of this issue can be obtained from the Superintendent of Documents, U.S. Government Printing Office (GPO), Washington, DC 20402-9371; telephone: (202) 512-1800. Contact GPO for current prices. **Questions or messages regarding errors in formatting should be addressed to mmwrq@cdc.gov.Date last reviewed: 6/26/2008 |
|||||||||
|