|
|
|
|
|
|
|
| ||||||||||
|
|
|
|
|
|
|
||||
| ||||||||||
|
|
|
|
|
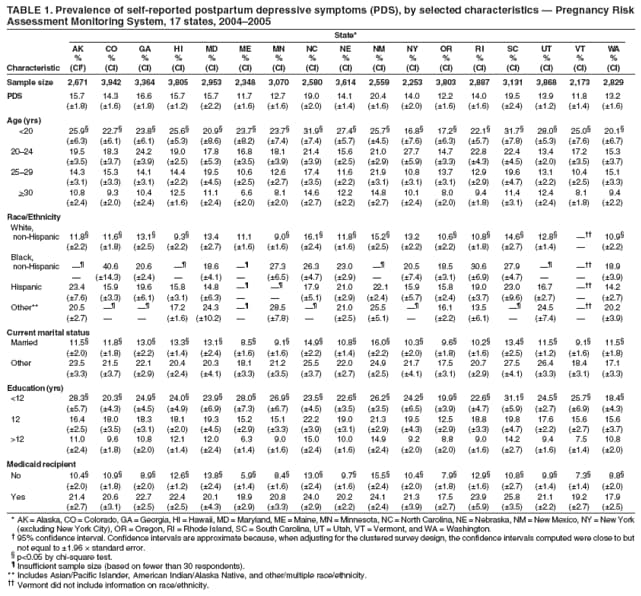
Persons using assistive technology might not be able to fully access information in this file. For assistance, please send e-mail to: mmwrq@cdc.gov. Type 508 Accommodation and the title of the report in the subject line of e-mail. Prevalence of Self-Reported Postpartum Depressive Symptoms --- 17 States, 2004--2005Postpartum depression (PPD) affects 10%--15% of mothers within the first year after giving birth (1). Younger mothers and those experiencing partner-related stress or physical abuse might be more likely to develop PPD (2,3). CDC analyzed data from the Pregnancy Risk Assessment Monitoring System (PRAMS) for 2004--2005 (the most recent data available) to 1) assess the prevalence of self-reported postpartum depressive symptoms (PDS) among mothers by selected demographic characteristics and other possible risk factors for PDS and 2) determine factors that identify mothers most likely to develop PPD. This report summarizes the results of that analysis, which indicated that, during 2004--2005, the prevalence of self-reported PDS in 17 U.S. states* ranged from 11.7% (Maine) to 20.4% (New Mexico). Younger women, those with lower educational attainment, and women who received Medicaid benefits for their delivery were more likely to report PDS. State and local health departments should evaluate the effectiveness of targeting mental health services to these mothers and incorporating messages about PPD into existing programs (e.g., domestic violence services) for women at higher risk. PRAMS is an ongoing, state-specific, population-based surveillance project that collects self-reported information on maternal attitudes and experiences before, during, and after delivery of a live infant. PRAMS is administered by CDC in collaboration with participating states and cities and is designed to be representative of women in participating states who have delivered during the preceding 2--6 months (4). Response rates were >70% for 2004 and 2005 in each of the 17 participating states. During 2004--2005, these 17 states included two questions on self-reported PDS in their PRAMS surveys: 1) "Since your new baby was born, how often have you felt down, depressed, or hopeless?" and 2) "Since your new baby was born, how often have you had little interest or little pleasure in doing things?" The response choices were "always," "often," "sometimes," "rarely," and "never"; women who said "often" or "always" to either question were classified as experiencing self-reported PDS. Because of their high sensitivity (96%), these two questions have been recommended as a depression case-finding instrument by health professionals (5,6). Chi-square tests were used to test for significant differences (p<0.05) in the proportion of women reporting PDS by demographic characteristics and other possible risk factors for PDS within each of the 17 states; approximate 95% confidence intervals for these proportions were calculated.† To measure the strength of the association overall, the median difference across all states in the proportion of women reporting PDS between two levels of each covariate was calculated. Sample sizes varied for each estimate because women who were missing data on any variable (<5% of all women) were excluded from analysis of that variable. The analysis was conducted using statistical software to adjust for the complex survey design and produce statewide estimates. Estimates based on small sample sizes (fewer than 30 respondents) were considered to be unreliable. The maternal characteristics analyzed included age at delivery, race/ethnicity, education, marital status, and receipt of Medicaid for delivery. Possible risk factors for PDS included in the analysis were low infant birth weight (<2,500 g), admission to a neonatal intensive-care unit (NICU), number of previous live births, tobacco use during the last 3 months of pregnancy, physical abuse before or during pregnancy, and experiencing emotional, financial, partner-related, or traumatic stress§ during the 12 months before delivery. Women were considered physically abused if they said that a current or former husband/partner had pushed, hit, slapped, kicked, choked, or physically hurt them in any way during the 12 months before or during the most recent pregnancy. Women who reported smoking one or more cigarettes on an average day were classified as using tobacco during the last 3 months of pregnancy. During 2004--2005, overall prevalence of self-reported PDS ranged from 11.7% (Maine) to 20.4% (New Mexico) (Table 1). Demographic characteristics significantly associated with PDS in all of the 17 states were maternal age, marital status, maternal education, and Medicaid coverage for delivery. Among the 17 states, the median percentage point difference in PDS prevalence was 13.4 percentage points between the youngest and oldest mothers, 13.6 between the lowest and highest education groups, 9.7 by marital status, and 11.0 by Medicaid receipt. In 13 of the 16 states for which data were available, a significant association was observed between race/ethnicity and PDS, with non-Hispanic white women having a lower prevalence of PDS compared with women of other racial/ethnic groups. PDS was significantly associated with five possible risk factors in all or nearly all of the 17 states (Table 2). The number of states with significant associations and state median percentage point differences in PDS prevalence for women with and without these risk factors were using tobacco during the last 3 months of pregnancy (16 states; median difference: 10.7), physical abuse before or during pregnancy (17 states; median difference: 22.4), partner-related stress during pregnancy (17 states; median difference: 16.4), traumatic stress during pregnancy (17 states; median difference: 16.4), and financial stress during pregnancy (17 states; median difference: 9.2). In 14 states, PDS was significantly associated with delivering a low birth weight infant and experiencing emotional stress during pregnancy. NICU admission was associated with PDS in nine states. The state median percentage point differences in PDS prevalence were 5.7 by low birth weight delivery, 5.2 by emotional stress, and 6.2 by NICU admission. The effect of parity on PDS was unclear; the association was significant in only two states, and the results were inconsistent across all states regarding risk for developing PDS. Reported by: K Brett, PhD, Office of Analysis and Epidemiology, National Center for Health Statistics; W Barfield, MD, Div of Reproductive Health, National Center for Chronic Disease Prevention and Health Promotion; C Williams, ScD, EIS Officer, CDC. Editorial Note:The continuum of depressive disorders after delivery ranges from "baby blues" to PPD. Although "baby blues" is more prevalent, the symptoms of this disorder, which occur within the first few weeks after delivery, are less severe and do not require treatment. PPD can occur up to a year after delivery, is more severe, and requires treatment by a physician. PPD has important consequences for the well-being of mothers and their children. For example, in a 2006 study, mothers who reported depressive symptoms were less likely to engage in practices to promote child development, such as playing with their infant (7). PPD also might also be associated with discontinuation of breastfeeding (8). The significant associations between PDS and young maternal age and experiencing partner-related stress or physical abuse indicated in this report are consistent with previous research (2,3). The other significant risk factors for PDS described in this report (i.e., delivery of a low birth weight infant, tobacco use during pregnancy, and experiencing traumatic or financial stress) have not been previously identified as significant factors (3). The associations are not unexpected, given that these risk factors all can be considered either actual stressors or indicators of stress during pregnancy. Further research is needed to examine the relationship between stressors during pregnancy and PDS. Association of PDS with other potential postpartum stressors, such as NICU admission and parity, were not consistent across states and also warrant further study. The findings in this report are subject to at least four limitations. First, data from the PRAMS survey are based on self-report and are not confirmed by physician diagnosis. The screening questions used in the survey have a low specificity (66%) which, although similar to that of other depression screening instruments, might produce a high rate of false positives, leading to overestimates of PPD prevalence (5). Second, mothers were asked about symptoms experienced since birth, so the duration of time about which symptoms are reported ranged from 2 to 6 months. Some women might have been misclassified as experiencing PDS because of depressive symptoms that were not associated with being postpartum, whereas others might have been misclassified because they developed PDS after the interview. However, these possible misclassifications should not differentially affect subgroups of women and, therefore, should not affect the associations identified in this report. Third, additional variables of interest, such as alcohol or illicit drug use, could not be analyzed because of limited sample sizes across all states. Finally, the analysis described in this report could not identify women with preexisting depression who might or might not also have reported PDS. These women might have been classified as experiencing PDS but might have required different interventions to address their condition than other women without a history of depression. A study conducted by a health maintenance organization found that 54.2% of women with PPD also had been diagnosed with depression either before or during their most recent pregnancy (9). The findings in this report can be used to estimate the number of women in each state requiring a more complete evaluation (and thus the potential burden on health-care services for those with suspected PPD). Although some states (e.g., Maryland) have already implemented methods for addressing PPD, more targeted screening and interventions for PPD could be directed at women at higher risk for developing PPD and incorporated into existing public health programs (e.g., those that address women who were physically abused). These women also could be more effectively targeted for public health interventions developed according to state and local needs and resources. Adolescent mothers or women who received Medicaid for their delivery are examples of subsets of the population at increased risk for developing PPD that could be easily identified at delivery for interventions in the postpartum period. The American College of Obstetricians and Gynecologists includes screening for PPD among the essential parts of a women's 4--6 week postpartum visit. Postpartum women also can be screened for PPD by pediatricians at their infants' well-child visits (10). Women who are considered to have self-reported PDS based on these screenings should be administered a full diagnostic interview because they are most likely to develop PPD. State and local health departments and other health-care providers can use these screening results in their maternal and child health needs assessments and in planning for the provision of appropriate mental health services to new mothers. Additionally, the effectiveness of targeting services to mothers at higher risk for PPD should be evaluated. Acknowledgments The findings in this report are based on contributions by members of the PRAMS Working Group and the CDC PRAMS Team, Div of Reproductive Health, National Center for Chronic Disease Prevention and Health Promotion, CDC. References
* Alaska, Colorado, Georgia, Hawaii, Maryland, Maine, Minnesota, North Carolina, Nebraska, New Mexico, New York (excluding New York City), Oregon, Rhode Island, South Carolina, Utah, Vermont, and Washington. † Confidence intervals are approximate because, when adjusting for the clustered survey design, the confidence intervals computed were close to but not equal to ±1.96 × standard error. § Stressors during pregnancy were categorized as 1) emotional (a very sick family member had to go into the hospital or someone close to the respondent died), 2) financial (the respondent moved to a new address, her husband/partner lost his job, she lost her job, or she had a lot of bills she could not pay; 3) partner-related (the respondent separated or divorced from her husband/partner, she argued more than usual with her husband/partner, or her husband/partner said he did not want her to be pregnant); and 4) traumatic (the respondent was homeless, she was involved in a physical fight, she or her husband/partner went to jail, or someone close to her had a problem with drinking/drugs).
Table 1
Disclaimer All MMWR HTML versions of articles are electronic conversions from ASCII text into HTML. This conversion may have resulted in character translation or format errors in the HTML version. Users should not rely on this HTML document, but are referred to the electronic PDF version and/or the original MMWR paper copy for the official text, figures, and tables. An original paper copy of this issue can be obtained from the Superintendent of Documents, U.S. Government Printing Office (GPO), Washington, DC 20402-9371; telephone: (202) 512-1800. Contact GPO for current prices. **Questions or messages regarding errors in formatting should be addressed to mmwrq@cdc.gov.Date last reviewed: 4/9/2008 |
|||||||||
|