|
|
|
|
|
|
|
| ||||||||||
|
|
|
|
|
|
|
||||
| ||||||||||
|
|
|
|
|
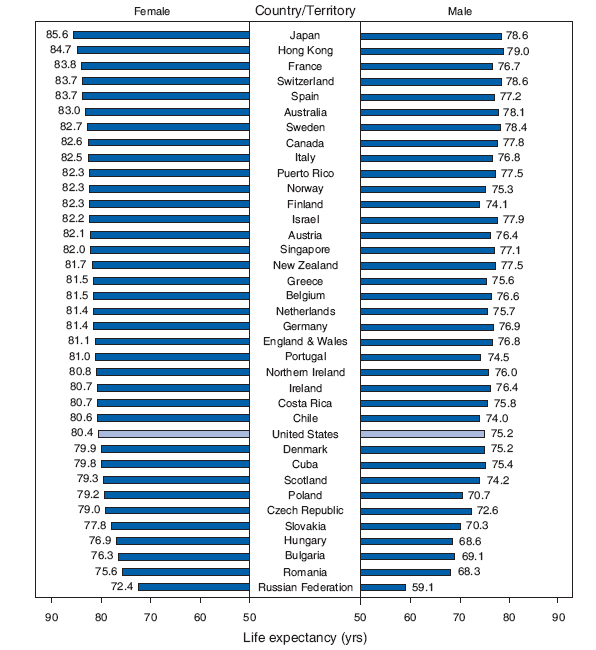
Persons using assistive technology might not be able to fully access information in this file. For assistance, please send e-mail to: mmwrq@cdc.gov. Type 508 Accommodation and the title of the report in the subject line of e-mail. QuickStats: Life Expectancy Ranking* at Birth,† by Sex --- Selected Countries and Territories, 2004§¶
* Rankings are from the highest to lowest female life expectancy at birth. † Life expectancy at birth represents the average number of years that a group of infants would live if the infants were to experience throughout life the age-specific death rates present at birth. § Countries and territories were selected based on quality of data, high life expectancy, and a population of at least 1 million population. Differences in life expectancy reflect differences in reporting methods, which can vary by country, and actual differences in mortality rates. ¶ Most recent data available. Data for Ireland and Italy are for 2003.
In 2004, life expectancy at birth ranged from a low of 59.1 years for the Russian male population to a high of 85.6 years for the female population of Japan. In the United States, life expectancy for men (75.2 years) ranked 25th out of 37 countries and territories and 23rd for women (80.4 years). Japan and Hong Kong were the countries with the highest life expectancy, whereas the countries of Eastern Europe (e.g., Russian Federation, Romania, and Bulgaria) reported the lowest life expectancy. SOURCES: Organisation for Economic Co-operation and Development. OECD health data 2007: statistics and indicators for 30 countries. Paris, France: Organisation for Economic Co-operation and Development; 2008. Available at http://www.oecd.org/health/healthdata. CDC. Health, United States, 2007. With chartbook on trends in the health of Americans. Hyattsville, MD: US Department of Health and Human Services, CDC, National Center for Health Statistics; 2007. Available at http://www.cdc.gov/nchs/data/hus/hus07.pdf.
Disclaimer All MMWR HTML versions of articles are electronic conversions from ASCII text into HTML. This conversion may have resulted in character translation or format errors in the HTML version. Users should not rely on this HTML document, but are referred to the electronic PDF version and/or the original MMWR paper copy for the official text, figures, and tables. An original paper copy of this issue can be obtained from the Superintendent of Documents, U.S. Government Printing Office (GPO), Washington, DC 20402-9371; telephone: (202) 512-1800. Contact GPO for current prices. **Questions or messages regarding errors in formatting should be addressed to mmwrq@cdc.gov.Date last reviewed: 4/2/2008 |
|||||||||
|