|
|
|
|
|
|
|
| ||||||||||
|
|
|
|
|
|
|
||||
| ||||||||||
|
|
|
|
|
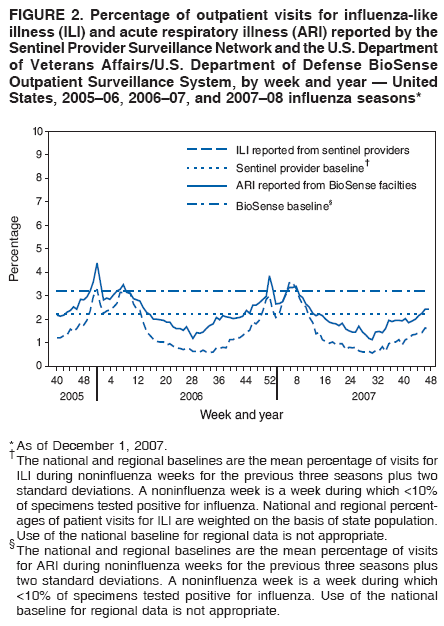
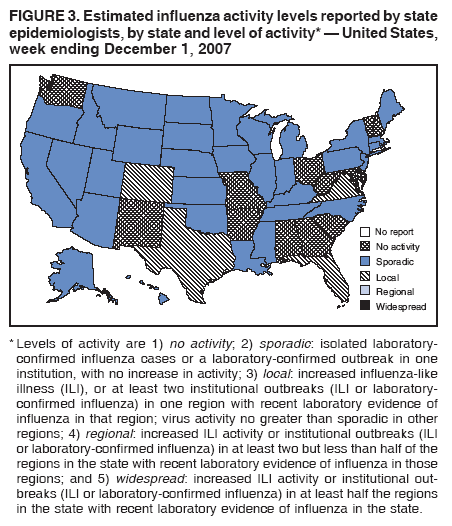
Persons using assistive technology might not be able to fully access information in this file. For assistance, please send e-mail to: mmwrq@cdc.gov. Type 508 Accommodation and the title of the report in the subject line of e-mail. Update: Influenza Activity --- United States, September 30--December 1, 2007During September 30--December 1, 2007, influenza activity remained low in the United States. This report summarizes U.S. influenza activity* since September 30, the start of the 2007--08 influenza season (1). Viral SurveillanceDuring September 30--December 1, 2007,† World Health Organization (WHO) and National Respiratory and Enteric Virus Surveillance System collaborating laboratories in the United States tested 24,897 respiratory specimens for influenza viruses, and 559 (2.2%) were positive (Figure 1). Of these, 515 (92%) were influenza A viruses, and 44 (8%) were influenza B viruses. One hundred thirty-five (26%) of the 515 influenza A viruses were subtyped; 112 (83%) of these were influenza A (H1) viruses, and 23 (17%) were influenza A (H3) viruses. Influenza virus--positive tests have been reported from the District of Columbia (DC) and 32 states in all nine surveillance regions since September 30. Antigenic CharacterizationWHO collaborating laboratories in the United States are requested to submit a subset of their influenza isolates to CDC for further antigenic characterization. Viral isolates are necessary for antigenic characterization. Many of the positive tests reported to CDC are from rapid antigen testing and, therefore, cannot be characterized further. Since September 30, 2007, U.S. laboratories have submitted approximately 80 influenza isolates for antigenic characterization, the majority of these during November 18--December 1. To date, CDC has antigenically characterized 27 influenza viruses; 19 (70%) of these were influenza A (H1) isolates, five (19%) were influenza A (H3) isolates, and three (11%) were influenza B isolates. Other isolates received since September 30 are being grown and characterized. All of the 19 influenza A (H1) viruses were A/Solomon Islands/3/2006-like, a recent antigenic variant of A/New Caledonia/20/99 and the strain recommended by WHO as the influenza A (H1) component for both the 2007--08 Northern Hemisphere influenza vaccine and the 2008 Southern Hemisphere influenza vaccine. Two influenza A (H3) isolates were A/Wisconsin/67/2005-like, the strain included in the 2007--08 Northern Hemisphere vaccine formulation. Three influenza A (H3) isolates were antigenically similar to A/Brisbane/10/2007, the strain recommended as the 2008 A (H3) component of influenza vaccines for the Southern Hemisphere. Each of the three influenza B viruses characterized belongs to the B/Yamagata/16/88 lineage. Influenza B viruses currently circulating worldwide can be divided into two antigenically distinct lineages represented by the B/Yamagata/16/88 and B/Victoria/02/87 viruses. The recommended influenza B component for the 2007--08 influenza vaccine is a B/Malaysia/2506/2004-like virus, belonging to the B/Victoria lineage. Novel Influenza A VirusesOne case of novel influenza A infection was reported from Michigan during the week ending November 3, 2007; a child aged 18 months was infected with swine influenza A (H1N2) virus in August 2007 after attending an agricultural event where swine were exhibited. The child walked through a barn containing pigs but was reported to have had no direct contact with the animals. The child recovered from the illness; no contacts of the child were reported to be ill. Outpatient Illness SurveillanceSince September 30, 2007, weekly percentages of outpatient visits for influenza-like illness (ILI)§ reported by approximately 1,300 U.S. sentinel providers in 50 states, New York City, Chicago, and DC have ranged from 0.9% to 1.6%. Weekly percentages of outpatient visits for acute respiratory illness (ARI)¶ reported by approximately 800 U.S. Department of Veterans Affairs (VA) BioSense outpatient treatment facilities and 350 U.S. Department of Defense (DoD) BioSense** outpatient treatment facilities have ranged from 1.8% to 2.4%. During the week ending December 1, approximately 1.6% of outpatient visits through the U.S. sentinel providers were attributed to ILI, and 2.4% of outpatient visits to the VA and DoD BioSense facilities were attributed to ARI, both of which are below the respective national baselines of 2.2%†† and 3.2%§§ (Figure 2). For the week ending December 1, all nine regions reported percentages of outpatient visits for ARI below their respective region-specific baselines. ARI data from the VA and DoD BioSense facilities also are analyzed by age groups (0--4 years, 5--17 years, 18--49 years, 50--64 years, and >65 years). The percentages of outpatient visits for ARI for all five age groups were below their respective age-specific baselines. State-Specific Activity LevelsFor the week ending December 1, 2007, influenza activity¶¶ was reported as local in four states (Colorado, Florida, Texas, and Virginia) and as sporadic in 33 states and DC (Figure 3). Thirteen states reported no activity. To date, no states have reported regional or widespread influenza activity this season. Pneumonia- and Influenza-Related MortalityFor the week ending December 1, 2007, pneumonia and influenza (P&I) was listed as an underlying or contributing cause of death for 6.1% of all deaths reported through the 122 Cities Mortality Reporting System (Figure 4). This percentage is below the epidemic threshold of 6.4% for that period. During the 2007--08 influenza season, the weekly percentage of deaths attributed to P&I has ranged from 5.7% to 6.1%. The percentage of deaths attributed to P&I exceeded the epidemic threshold for 3 consecutive weeks during September 30--October 20 but has remained below the epidemic threshold since the week ending October 27.*** Influenza-Associated Pediatric HospitalizationsPediatric hospitalizations associated with laboratory-confirmed influenza infections are monitored by two population-based surveillance networks, the Emerging Infections Program (EIP) and the New Vaccine Surveillance Network (NVSN).††† To date, no influenza-associated pediatric hospitalizations have been reported from NVSN this season. During September 30--November 24, 2007, the preliminary laboratory-confirmed influenza-associated hospitalization rate reported by EIP for children was within the expected range for this time of year. For children aged 0--17 years, the influenza-associated hospitalization rate was 0.006 per 10,000. For children aged 0--4 years and 5--17 years, the rates were 0.01 and 0.003 per 10,000, respectively. Influenza-Related Pediatric MortalityOne influenza-associated pediatric death occurring during the 2007--08 season has been reported to CDC through the National Notifiable Diseases Surveillance System. The death occurred in Texas during the week ending November 10, 2007, and was reported to CDC during the week ending December 1. Reported by: WHO Collaborating Center for Surveillance, Epidemiology, and Control of Influenza. M Patton, L Blanton, MPH, L Brammer, MPH, A Budd, MPH, T Wallis, MS, D Shay, MD, J Bresee, MD, A Klimov, PhD, N Cox, PhD, Influenza Div, National Center for Immunization and Respiratory Diseases, CDC. Editorial Note:During September 30--December 1, 2007, the United States experienced a low level of influenza activity typical for this time of year. Influenza seasons can vary substantially in terms of timing and pattern of onset, peak, decline, and overall severity. Although influenza activity has peaked as early as November, February has been the peak month in 11 of the past 20 years. Influenza activity for the 2007--08 season thus far is similar to that observed for the same period during the past 5 years, with the exception of the 2003--04 season, which began unusually early. To date, no states have reported regional or widespread activity for the 2007--08 season. For the same period during the past 5 years, with the exception of the 2003--04 season, the number of states reporting regional or widespread activity ranged from zero to six. Similarly, no surveillance system components during the same period have indicated influenza activity above baseline levels, except during the 2003--04 season. P&I mortality exceeded threshold levels for the first 3 weeks of this season (September 30--October 27) and for the 4 weeks before the start of the season (September 2--29), but has remained below the epidemic threshold since the week ending October 27. During the weeks when the P&I baseline was exceeded, no increase in influenza activity was detected in any other surveillance component. Both national and regional percentages of deaths attributed to P&I during those 7 weeks were similar to the percentages reported for the same period during the previous year. The baseline percentage of P&I deaths is projected for the current season based on P&I data from the previous 5 years. Because the 5-year period used to project the 2007--08 season baseline included three mild seasons, the elevation might be an artifact of a low baseline. CDC will continue to closely monitor trends in P&I mortality. In 2007, human infection with a novel influenza A virus, including swine influenza viruses, became a nationally notifiable condition. One case of human infection with swine influenza virus has been reported in the United States since September 30, 2007. Although human infection with swine influenza viruses is uncommon, sporadic cases can occur, usually among persons in direct contact with ill pigs or who have been in places where pigs have been present (e.g., agricultural fairs or farms). Clinicians should consider swine influenza A in the differential diagnosis of patients with ILI who have had recent contact with pigs. The sporadic cases identified in recent years have not resulted in sustained human-to-human transmission or community outbreaks. However, human infections with swine influenza viruses or any other nonhuman or novel influenza virus should be identified quickly and investigated to determine possible sources of exposure, identify additional cases, and evaluate the possibility of human-to-human transmission because transmission patterns might change with variations in swine influenza viruses. Vaccination is the best method for prevention of influenza and its potentially severe complications. Influenza vaccine should be administered to any person who wants to reduce the likelihood of becoming ill with influenza or transmitting influenza to others. Annual influenza vaccination, as recommended by the Advisory Committee on Immunization Practices (ACIP) (2), is targeted toward persons at increased risk for influenza-related complications and severe disease (e.g., children aged 6--59 months, pregnant women, persons aged >50 years, and persons aged 5--49 years with certain chronic medical conditions) and their close contacts (e.g., health-care workers and household contacts of persons at increased risk, including contacts of children aged <6 months) (2). In addition, all children aged 6 months--9 years who have not been vaccinated previously at any time should receive 2 doses of influenza vaccine, and those who only received 1 dose in their first year should receive 2 doses in the following year (2). To maximize the benefit from vaccination, persons should be vaccinated before increases of influenza activity occur in their community. Because influenza activity remains low in all parts of the United States and does not typically peak until January or later, persons not yet vaccinated should get vaccinated and vaccine providers should continue to encourage vaccination in December and beyond (2). Given the low levels of influenza activity in the United States this season, few virus samples are yet available for antigenic characterization and might not be representative of the virus strains that will predominate this season. How well the current vaccine strains will match the strains that circulate this season will be determined as more strains become available for analysis. However, even in years that the vaccine and circulating strains are not optimally matched, the vaccine still provides protection against related influenza viruses (3--5). Influenza surveillance reports for the United States are posted online weekly during October--May and are available at http://www.cdc.gov/flu/weekly/fluactivity.htm. Additional information regarding influenza viruses, influenza surveillance, the influenza vaccine, and avian influenza is available at http://www.cdc.gov/flu. Acknowledgments This report is based on data contributed by participating state and territorial health departments and state public health laboratories, World Health Organization collaborating laboratories, National Respiratory and Enteric Virus Surveillance System collaborating laboratories, the U.S. Influenza Sentinel Provider Surveillance System, the U.S. Department of Veterans Affairs/U.S. Department of Defense BioSense Outpatient Surveillance System, the New Vaccine Surveillance Network, the Emerging Infections Program, and the 122 Cities Mortality Reporting System. References
* The CDC influenza surveillance system collects five categories of information from 10 data sources. Viral surveillance: U.S. World Health Organization collaborating laboratories, the National Respiratory and Enteric Virus Surveillance System, and novel influenza A virus case reporting. Outpatient illness surveillance: U.S. Influenza Sentinel Provider Surveillance Network and the U.S. Department of Veterans Affairs/U.S. Department of Defense BioSense Outpatient Surveillance System. Mortality: 122 Cities Mortality Reporting System and influenza-associated pediatric mortality reports. Hospitalizations: Emerging Infections Program and New Vaccine Surveillance Network. Summary of geographic spread of influenza: state and territorial epidemiologist reports. † As of December 1, 2007, reporting is incomplete. § Defined as a temperature of >100.0ºF (>37.8ºC), oral or equivalent, and cough and/or sore throat, in the absence of a known cause other than influenza. ¶ Based on International Classification of Diseases, Ninth Revision codes for ARI: 460--66 and 480--88. ** BioSense is a national surveillance system that receives, analyzes, and evaluates health data from multiple sources, including 1) approximately 1,150 VA/DoD hospitals and ambulatory-care clinics; 2) multihospital systems, local hospitals, and state and regional syndromic surveillance systems in 37 states; and 3) Laboratory Corporation of America (LabCorp) test orders. †† The national and regional baselines are the mean percentage of visits for ILI during noninfluenza weeks for the previous three seasons plus two standard deviations. A noninfluenza week is a week during which <10% of specimens tested positive for influenza. National and regional percentages of patient visits for ILI are weighted on the basis of state population. Use of the national baseline for regional data is not appropriate. §§ The national, regional, and age-specific baselines are the mean percentage of visits for ARI during noninfluenza weeks for the previous three seasons plus two standard deviations. A noninfluenza week is a week during which <10% of specimens tested positive for influenza. Use of the national baseline for regional data is not appropriate. ¶¶ Levels of activity are 1) no activity; 2) sporadic: isolated laboratory-confirmed influenza cases or a laboratory-confirmed outbreak in one institution, with no increase in activity; 3) local: increased ILI, or at least two institutional outbreaks (ILI or laboratory-confirmed influenza) in one region with recent laboratory evidence of influenza in that region; virus activity no greater than sporadic in other regions; 4) regional: increased ILI activity or institutional outbreaks (ILI or laboratory-confirmed influenza) in at least two but less than half of the regions in the state with recent laboratory evidence of influenza in those regions; and 5) widespread: increased ILI activity or institutional outbreaks (ILI or laboratory-confirmed influenza) in at least half the regions in the state with recent laboratory evidence of influenza in the state. *** The seasonal baseline proportion of P&I deaths is projected using a robust regression procedure in which a periodic regression model is applied to the observed percentage of deaths from P&I that were reported by the 122 Cities Mortality Reporting System during the preceding 5 years. The epidemic threshold is 1.645 standard deviations above the seasonal baseline. ††† NVSN conducts surveillance in Monroe County, New York; Hamilton County, Ohio; and Davidson County, Tennessee. NVSN provides population-based estimates of laboratory-confirmed influenza hospitalization rates in children aged <5 years admitted to NVSN hospitals with fever or respiratory symptoms. Children are prospectively enrolled, and respiratory samples are collected and tested by viral culture and reverse transcription--polymerase chain reaction (RT-PCR). EIP conducts surveillance in 60 counties associated with 12 metropolitan areas: San Francisco, California; Denver, Colorado; New Haven, Connecticut; Atlanta, Georgia; Baltimore, Maryland; Minneapolis/St. Paul, Minnesota; Albuquerque, New Mexico; Las Cruces, New Mexico; Albany, New York; Rochester, New York; Portland, Oregon; and Nashville, Tennessee. EIP conducts surveillance for laboratory-confirmed, influenza-related hospitalizations in persons aged <18 years. Hospital laboratory and admission databases and infection-control logs are reviewed to identify children with a positive influenza test (i.e., viral culture, direct fluorescent antibody assays, RT-PCR, or a commercial rapid antigen test) from testing conducted as a part of their routine care. Figure 1
Disclaimer All MMWR HTML versions of articles are electronic conversions from ASCII text into HTML. This conversion may have resulted in character translation or format errors in the HTML version. Users should not rely on this HTML document, but are referred to the electronic PDF version and/or the original MMWR paper copy for the official text, figures, and tables. An original paper copy of this issue can be obtained from the Superintendent of Documents, U.S. Government Printing Office (GPO), Washington, DC 20402-9371; telephone: (202) 512-1800. Contact GPO for current prices. **Questions or messages regarding errors in formatting should be addressed to mmwrq@cdc.gov.Date last reviewed: 12/12/2007 |
|||||||||
|