|
|
|
|
|
|
|
| ||||||||||
|
|
|
|
|
|
|
||||
| ||||||||||
|
|
|
|
|
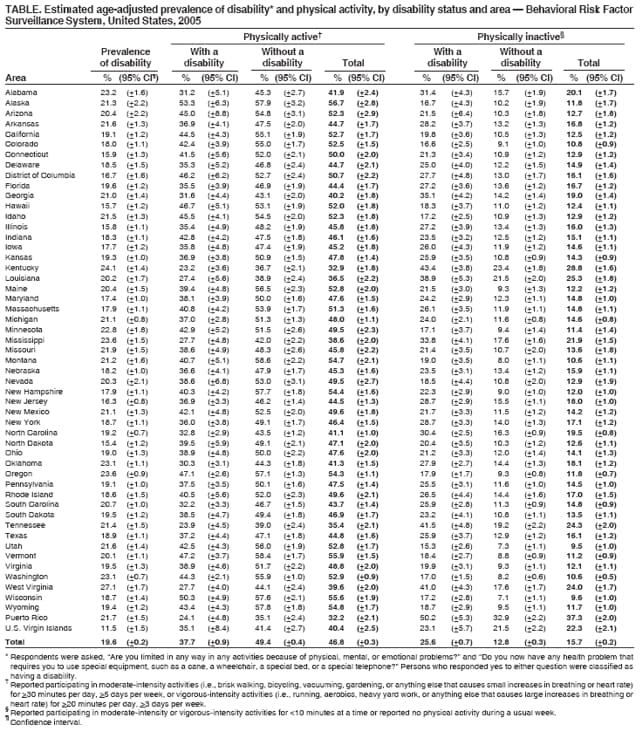
Persons using assistive technology might not be able to fully access information in this file. For assistance, please send e-mail to: mmwrq@cdc.gov. Type 508 Accommodation and the title of the report in the subject line of e-mail. Physical Activity Among Adults With a Disability --- United States, 2005The health benefits of physical activity have been well documented (1,2) and are supported by recommendations from Healthy People 2010 (focus area 22) (3); however, fewer than half of U.S. adults follow these recommendations (4). Physical inactivity is particularly prevalent among adults with a disability (5), who are at increased risk for functional limitations and secondary health conditions (e.g., obesity, depression, or social isolation) (6) that can result from their disabilities, behavior, lifestyle, or environment (1). To estimate the state-specific prevalence of physical activity and physical inactivity among adults with and without a disability, CDC analyzed data from the 2005 Behavioral Risk Factor Surveillance System (BRFSS). This report summarizes the results of that analysis, which determined that, compared with adults without a disability, a smaller proportion of adults with a disability met national recommendations for physical activity (37.7% versus 49.4%), and a greater proportion were physically inactive (25.6% versus 12.8%). Public health measures to promote and increase physical activity should include consideration for the needs of adults with disabilities. BRFSS is a state-based, random-digit--dialed telephone survey of the noninstitutionalized, U.S. civilian population aged >18 years. In 2005, approximately 350,000 persons from all 50 states, the District of Columbia, Puerto Rico (PR), and the U.S. Virgin Islands (USVI) participated in BRFSS. Consistent with the definition of disability from Healthy People 2010 (3), respondents were asked, "Are you limited in any way in any activities because of physical, mental, or emotional problems?" and "Do you now have any health problem that requires you to use special equipment, such as a cane, a wheelchair, a special bed, or a special telephone?" Persons who responded yes to either question were classified as having a disability. To measure physical activity, respondents were asked how often they engaged in physical activities of moderate intensity (i.e., brisk walking, bicycling, vacuuming, gardening, or anything else that causes small increases in breathing or heart rate) and vigorous intensity (i.e., running, aerobics, heavy yard work, or anything else that causes large increases in breathing or heart rate) for at least 10 minutes at a time during a usual week.* Respondents were classified as meeting physical activity recommendations if they reported engaging in moderate-intensity activity for >30 minutes per day, >5 days per week, or vigorous-intensity activity for >20 minutes per day, >3 days per week. Respondents were classified as physically inactive if they reported participating in moderate-intensity or vigorous-intensity activities for <10 minutes at a time during a usual week or reported no physical activity during a usual week. The Council of American Survey Research Organizations (CASRO) median response rate for the 2005 BRFSS was 51.1% Prevalence estimates were age-adjusted to the 2000 U.S. standard population. Bivariate analyses and chi-square tests were used to compare physical activity levels among those with and those without a disability, and all differences reported were considered to be statistically significant at p<0.05. State-level prevalence estimates and 95% confidence intervals were calculated. Nationwide in 2005, an estimated 19.6% of adults had a disability. Among states and territories, the prevalence of disability ranged from 11.5% in USVI to 27.1% in West Virginia (Table). Nationwide, a smaller proportion of adults with a disability engaged in recommended levels of physical activity than respondents without a disability (37.7% versus 49.4%; p<0.01). A smaller proportion of adults with a disability met recommended levels for physical activity than adults without a disability in all states and territories except USVI, where the difference was not significant. Among states and territories, the prevalence of persons with a disability who met recommended physical activity levels ranged from 23.2% in Kentucky to 53.3% in Alaska. Nationwide, 25.6% of persons with a disability reported being physically inactive during a usual week compared with 12.8% of those without a disability (p<0.01). Adults with a disability were more likely than those without a disability to be physically inactive in all states and territories except USVI, where the difference was not significant. Among persons with a disability, the prevalence of physical inactivity ranged from 15.3% in Utah to 50.2% in PR. Reported by: JH Rimmer, PhD, Dept of Disability and Human Development, Univ of Illinois at Chicago. LA Wolf, MPH, BS Armour, PhD, LB Sinclair, MPH, Div of Human Development and Disability, National Center for Birth Defects and Developmental Disabilities, CDC. Editorial Note:The findings in this report indicate that, in 2005, the proportion of persons without a disability in 28 of 53 (52.8%) U.S. states and territories surpassed the 50% target for meeting moderate or vigorous physical activity recommendations set by Healthy People 2010 (objective 22-2).† However, the proportion of persons with a disability surpassed the same target in only two of 53 (3.7%) states and territories (Table). Furthermore, the findings indicate that the proportion of adults with a disability who were physically inactive (25.6%) during a usual week was nearly twice the proportion of adults without a disability who were inactive (12.8%). These results are consistent with those of previous reports finding significant differences in physical activity levels between persons with and without a disability (5). Physical inactivity among persons with a disability might be more common than among persons without a disability because the inactivity is a consequence of 1) the disabling condition itself, 2) physiologic decline (e.g., decreased aerobic capacity, muscular strength and endurance, or flexibility), or 3) lack of access to physical-activity programs and facilities because of personal or environmental barriers (7). Persons with a disability often experience barriers to regular physical activity that differ from those experienced by the general population, including lack of transportation to fitness centers, lack of information on available and accessible facilities and programs, lack of accessible exercise equipment and adequate space to move about, and the perception that fitness facilities are unfriendly environments for those with a disability (7). Such barriers can result in a decline in physical function and a cycle of deconditioning, in which deteriorating physical function produces greater inactivity, further physical decline, and an increase in the number or severity of secondary conditions (8). To overcome deconditioning, public health officials and others designing strategies to increase adult physical activity should devise ways to eliminate barriers that limit participation by persons with a disability (2). The findings in this report are subject to at least two limitations. First, BRFSS excludes persons living in institutions or group homes. Therefore, the results likely underestimate the actual prevalence of adults with a disability. Second, BRFSS questions relating to physical activity were developed and validated for the population without a disability, and the activities described (e.g., brisk walking, bicycling, vacuuming, or running) might be more demanding and difficult for a person with a disability. The need for a physical-activity scale specific to persons with a disability has been suggested (9). Physical inactivity among persons with a disability is associated with increased functional limitation and higher risk for developing secondary conditions (1,2). Although not all adults with a disability are able to achieve recommended levels of physical activity because of the nature or severity of their disability, participation at lower levels has been determined to confer health benefits (e.g., pain reduction) (2). Persons unable to meet recommended levels might require physical-activity regimens tailored to their specific needs. In addition, certain barriers to physical activity are unique to persons with a disability. Public health agencies and stakeholders should ensure that barriers to participation are addressed in the design of programs to promote health and physical activity. References
* The 2005 BRFSS questionnaire is available at http://www.cdc.gov/brfss/questionnaires/pdf-ques/2005brfss.pdf. † Healthy People 2010 midcourse review: physical activity and fitness. Available at http://www.healthypeople.gov/data/midcourse/pdf/fa22.pdf.
Disclaimer All MMWR HTML versions of articles are electronic conversions from ASCII text into HTML. This conversion may have resulted in character translation or format errors in the HTML version. Users should not rely on this HTML document, but are referred to the electronic PDF version and/or the original MMWR paper copy for the official text, figures, and tables. An original paper copy of this issue can be obtained from the Superintendent of Documents, U.S. Government Printing Office (GPO), Washington, DC 20402-9371; telephone: (202) 512-1800. Contact GPO for current prices. **Questions or messages regarding errors in formatting should be addressed to mmwrq@cdc.gov.Date last reviewed: 10/3/2007 |
|||||||||
|