|
|
|
|
|
|
|
| ||||||||||
|
|
|
|
|
|
|
||||
| ||||||||||
|
|
|
|
|
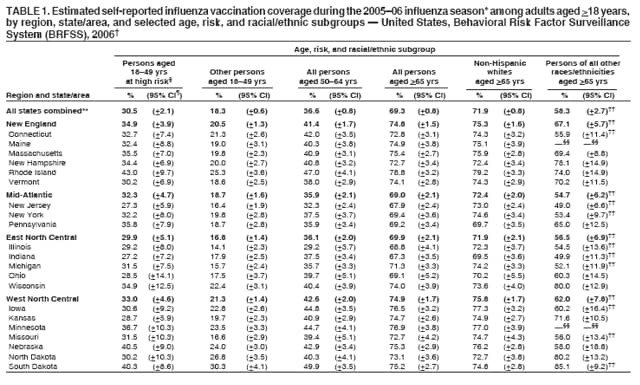
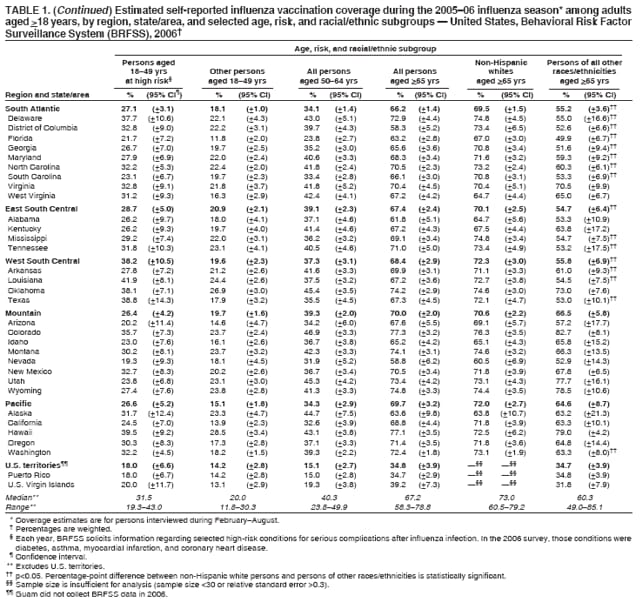
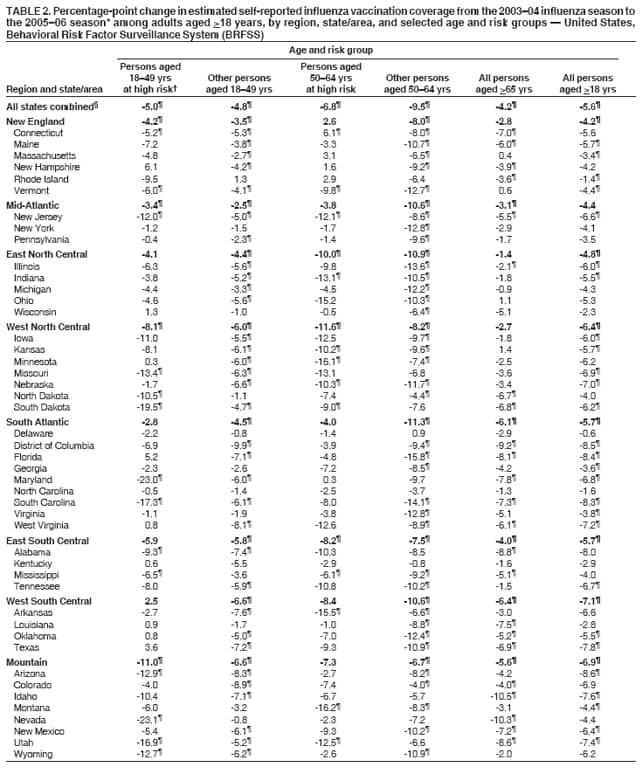
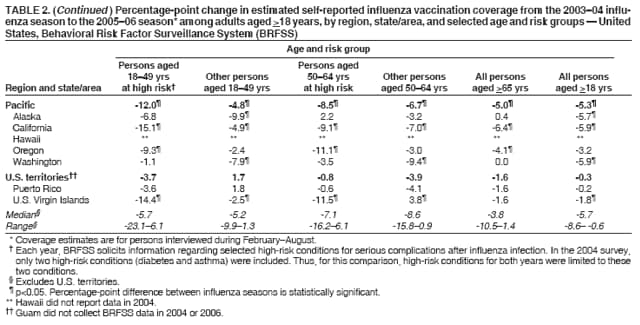
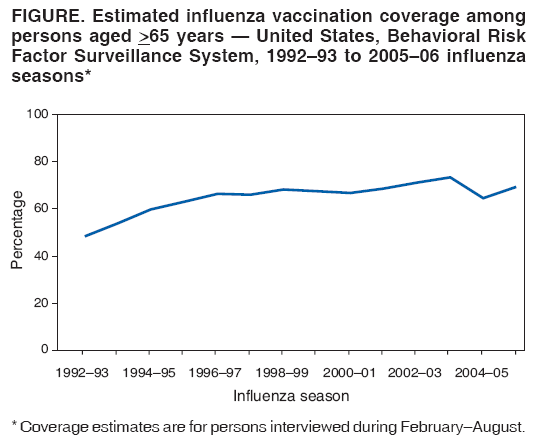
Persons using assistive technology might not be able to fully access information in this file. For assistance, please send e-mail to: mmwrq@cdc.gov. Type 508 Accommodation and the title of the report in the subject line of e-mail. State-Specific Influenza Vaccination Coverage Among Adults Aged >18 Years --- United States, 2003--04 and 2005--06 Influenza SeasonsInfluenza epidemics occur seasonally and result in substantial morbidity and mortality among adults in the United States (1). Adult groups included in the 2007 Advisory Committee on Immunization Practices (ACIP) recommendation for annual influenza vaccination are persons aged 18--49 years with high-risk conditions (i.e., conditions associated with an increased risk for complications from influenza),* persons aged >50 years, health-care personnel, and others who are household contacts or caregivers of persons at high risk (e.g., persons with high-risk conditions or children aged <59 months). In addition, adults who want to reduce the risk for becoming ill with influenza or of transmitting influenza to others should be vaccinated.† Healthy People 2010 (HP2010) objectives include increasing vaccination levels to 90% for adults aged >65 years (objective 14-29a) and 60% for persons aged 18--64 years who have one or more high-risk conditions (objective 14-29c) (2). From the 1992--93 through 2003--04 influenza seasons, seasonal influenza vaccination coverage estimates (based on Behavioral Risk Factor Surveillance System [BRFSS] data) among adults aged >65 years trended upward, except for three seasons (1997--98, 1999--00, and 2000--01) when no increases occurred (Figure).§To evaluate recent state-specific progress toward the HP2010 objectives, CDC compared data from the 2004 and 2006 BRFSS surveys, which reflected vaccinations received during the 2003--04 and 2005--06 influenza seasons; data from the 2004--05 influenza season, which have been published previously (3), were not included in this comparison because that season was marked by a substantial shortage of influenza vaccine. This report describes the results of the analysis, which indicated that influenza vaccination coverage for the 2005--06 season did not return to levels observed before the vaccine shortage of 2004--05 and remained substantially below HP2010 targets. Comprehensive measures are needed to improve influenza vaccination coverage among adult populations in the United States, including increasing adoption of recommended adult immunization practices by health-care providers (4), raising public awareness about influenza vaccination, vaccinating throughout the influenza season, and ensuring stable supplies of readily available vaccine. BRFSS is a state-based, random-digit--dialed telephone survey of the noninstitutionalized, U.S. civilian population aged >18 years. Data are weighted by age, sex, and, in certain states, race/ethnicity, to reflect the estimated adult population in each area. The survey is conducted in all 50 states, the District of Columbia, and three U.S. territories (Guam, Puerto Rico, and the U.S. Virgin Islands). Respondents were asked, "During the past 12 months, have you had a flu shot?" and "During the past 12 months, have you had a flu vaccine that was sprayed in your nose?" Respondents with an affirmative answer to either question were considered to have been vaccinated during the preceding influenza season. (Fewer than 1% reported receiving the nasal spray vaccine only.) To assess coverage for each September--January period, when the majority of vaccinations are administered during any influenza season, CDC restricted analysis to respondents interviewed during February--August after each season (e.g., to assess coverage for the 2005--06 season, analysis was restricted to respondents interviewed during February--August 2006). The median state response rate (i.e., the ratio of completed interviews to the sum of completed interviews, refusals, and terminated interviews), based on Council of American Survey and Research Organizations guidelines, was 52.7% (range: 32.2%--66.6%) in 2004 and 51.4% (range: 35.1%--66.0%) in 2006.¶ The median state cooperation rate was 74.5% (range: 56.9%--83.5%). A total of 303,822 persons aged >18 years completed interviews in 2004 and 355,710 in 2006; of these, 176,994 in 2004 and 210,335 in 2006 were interviewed during February--August. Respondents for whom information on influenza vaccination status was missing (0.30% in 2004 and 0.46% in 2006) were excluded from this analysis. Each year, BRFSS also solicits information regarding selected high-risk conditions for serious complications after influenza infection. In the 2006 survey, those conditions were diabetes, asthma, myocardial infarction, and coronary heart disease. In the 2004 survey, only two high-risk conditions (diabetes and asthma) were included. Estimated influenza vaccination coverage for the 2005--06 season was 30.5% among persons aged 18--49 years with the identified high-risk conditions, compared with 18.3% among all other persons aged 18--49 years (Table 1). State-specific influenza vaccination coverage among persons aged 18--49 years with high-risk conditions ranged from 43.0% in Rhode Island to 19.3% in Nevada (median: 31.5%). The median percentage-point change in influenza vaccination coverage among persons aged 18--49 years with high-risk conditions from the 2003--04 season to the 2005--06 season was -5.7 (range: -23.1--6.1) (Table 2), and the decline in influenza vaccination coverage was statistically significant in five regions** and 22 states. Among adults aged 50--64 years, influenza vaccination coverage for the 2005--06 season was 36.6% overall, ranging from 49.9% in South Dakota to 23.8% in Florida (median: 40.3%) (Table 1). Influenza vaccination coverage for the 2005--06 season was 48.4% (95% confidence interval [CI] = +1.7) among persons aged 50--64 years with the identified high-risk conditions, compared with 32.2% (CI = +0.9) among all other persons aged 50--64 years. The median percentage-point changes in influenza vaccination coverage from the 2003--04 to 2005--06 season were -7.1 (range: -16.2--6.1) among persons with identified high-risk conditions and -8.6 (range: -15.8--0.9) among all other persons aged 50--64 years (Table 2); these changes were statistically significant in four of the nine regions. Among adults aged >65 years, influenza vaccination coverage for the 2005--06 season was 69.3%, ranging from 78.8% in Rhode Island to 58.3% in the District of Columbia (median: 67.2%) (Table 1). Coverage was higher for non-Hispanic whites (71.9%) compared with other racial/ethnic groups (58.3%). Among these other racial/ethnic groups, coverage was 51.8% (CI = +3.5) for non-Hispanic blacks, 64.0% (CI = +14.7) for Asians, 62.9% (CI = +10.2) for American Indians/Alaska Natives, and 60.7% (CI = +5.6) for Hispanics. The median percentage-point change in coverage from the 2003--04 season to the 2005--06 season among persons aged >65 years was -3.8 overall (range: -10.5--1.4) (Table 2). Reported by: PJ Lu, PhD, GL Euler, DrPH, GT Mootrey, DO, F Ahmed, MD, PhD, JA Singleton, MS, Immunization Svcs Div, National Center for Immunization and Respiratory Diseases, CDC. Editorial Note:The findings in this report indicate that influenza vaccination coverage in all states during the 2005--06 influenza season was substantially below the HP2010 targets. Vaccination coverage in each age and risk group declined significantly for the 2005--06 influenza season compared with the 2003--04 season, indicating a possible lingering effect on coverage caused by the vaccine shortage during the 2004--05 season. In October 2004, one of the influenza vaccine manufacturers announced that it could not supply any vaccine to the United States, reducing to nearly one half the expected supply of trivalent inactivated influenza vaccine. This announcement prompted revised recommendations that the vaccine be administered first to persons in certain priority groups: persons aged >65 years, persons aged 2--64 years with high-risk conditions, health-care workers, household contacts of children aged <6 months, and children aged 6--23 months (5). Thus, healthy persons aged 50--64 years were not considered a priority group even though influenza vaccination is routinely recommended for this group. The findings in this report suggest that the rebound in vaccination coverage rates after the 2004--05 season among persons aged 50--64 years who were not at high risk was smaller than that observed among persons in this age group at high risk. Influenza vaccine supply was adequate for the 2005--06 influenza season, although the distribution of vaccine from one manufacturer was delayed, which could have contributed to decreases in coverage. Among persons aged >65 years, non-Hispanic whites had markedly higher vaccination coverage than other racial/ethnic groups. This result is consistent with findings of other studies that have documented racial/ethnic differences in influenza vaccination coverage among persons aged >65 years in the United States (6,7). These differences are not accounted for by differences in health-care access or socioeconomic status variables and might result from a combination of factors, including differences in 1) attitudes toward vaccination and preventive care, 2) quality of care, 3) patient-provider interactions, and 4) propensity to seek and accept vaccination (6--8). Previous reports have indicated that recommendations by health-care providers influence decisions by patients to be vaccinated (8,9). Health-care providers should routinely assess the influenza vaccination status of their patients and ensure that influenza vaccine is offered (usually beginning in October) to all patients throughout the influenza season. Influenza vaccine should be administered to all persons who want to reduce their risk for becoming ill with influenza or transmitting the virus to others. For adult patients aged <50 years, health-care providers should determine whether influenza vaccination is indicated based on 1) the presence of a high-risk medical condition or 2) whether the patient is a household contact or caregiver of a person aged >50 years or <5 years or with a high-risk medical condition. Particular attention is needed to improve vaccination coverage among older adults in racial/ethnic minority groups. Health-care systems should adopt and implement effective strategies (10), including those developed by the Joint Commission on Accreditation of Health Care Organizations, that have been demonstrated to increase vaccination rates.†† The findings in this report are subject to at least five limitations. First, BRFSS excludes persons without landline telephones. Second, BRFSS has median response rates below 60%; however, BRFSS data consistently have been demonstrated to provide valid and reliable estimates when compared with national household surveys in the United States.§§ Third, data are self-reported and subject to recall bias and misclassification bias. Fourth, sample sizes for both Hispanics and non-Hispanic blacks were too small for meaningful assessment of vaccination by age and racial/ethnic groups at state levels. Finally, respondents were not asked about certain high-risk conditions (e.g., emphysema, cancer, kidney diseases, and neurologic conditions that impair lung function) or other recommended indications for influenza vaccination (e.g., being a health-care worker or a member of a household with a person at high risk). To quantify the effect of limiting participants to persons with landline telephones, CDC compared the results for all states combined with estimates from the 2006 National Health Interview Survey (NHIS). NHIS, a national, in-person household survey conducted annually, includes households without landline telephones and has higher response rates (70.8% in 2006) than BRFSS.¶¶ Estimated influenza vaccination coverage from the 2006 NHIS was lower than that in BRFSS for all age groups examined (25.2% among persons aged 18--49 years with high-risk conditions, 32.5% among persons aged 50--64 years, and 65.3% among persons aged >65 years). During the 2006--07 influenza season, approximately 218.1 million persons in the United States (73.1% of the 2006 U.S. census population) were included in the ACIP-recommended target groups for influenza vaccination; however, on the basis of current trends, fewer than 50% are receiving their annual influenza vaccination.*** To achieve the Healthy People 2010 objectives and further improve vaccination coverage among all population subgroups, comprehensive strategies are required and should include 1) promoting vaccine-seeking behavior by consumers, 2) increasing demand for vaccinations among groups targeted for influenza vaccination, 3) increasing access to vaccination at nontraditional sites (e.g., pharmacies, churches, and senior centers), 4) increasing use of reminder-recall systems, 5) increasing targeted media promotions and educational programs, 6) expanding the use of standing orders, and 7) implementing more comprehensive provider-based or system-based interventions (10). In addition, vaccine supply and distribution problems that remain should be addressed. References
* High-risk conditions include chronic pulmonary, cardiovascular, renal, hepatic, hematologic, or metabolic disorders; immunosuppression; cognitive dysfunction; spinal cord injuries; seizure disorders; and other neuromuscular disorders. † Recommendations available at http://www.cdc.gov/mmwr/preview/mmwrhtml/rr5606a1.htm. § Additional information for comparison available at http://www.cdc.gov/flu/professionals/vaccination/#coverage. ¶ Additional information available at http://www.cdc.gov/brfss/technical_infodata/quality.htm. ** The nine regions (which are identical to the nine divisions of the U.S. census) are New England (Connecticut, Maine, Massachusetts, New Hampshire, Rhode Island, and Vermont); Mid-Atlantic (New Jersey, New York, and Pennsylvania); East North Central (Illinois, Indiana, Michigan, Ohio, and Wisconsin); West North Central (Iowa, Kansas, Minnesota, Missouri, Nebraska, North Dakota, and South Dakota); South Atlantic (Delaware, District of Columbia, Florida, Georgia, Maryland, North Carolina, South Carolina, Virginia, and West Virginia); East South Central (Alabama, Kentucky, Mississippi, and Tennessee); West South Central (Arkansas, Louisiana, Oklahoma, and Texas); Mountain (Arizona, Colorado, Idaho, Montana, Nevada, New Mexico, Utah, and Wyoming); and Pacific (Alaska, California, Hawaii, Oregon, and Washington). †† Additional information available at http://www.jointcommission.org/newsroom/newsreleases/nr_08_npsgs_dsc.htm. §§ Additional information available at http://elib.cdc.gov:2259/cgi/content/full/93/8/1335. ¶¶ Additional information available at http://www.cdc.gov/nchs/about/major/nhis/quest_data_related_1997_forward.htm. *** Additional information available at http://www.cdc.gov/flu/professionals/vaccination/pdf/targetpopchart.pdf.
Table 1
Disclaimer All MMWR HTML versions of articles are electronic conversions from ASCII text into HTML. This conversion may have resulted in character translation or format errors in the HTML version. Users should not rely on this HTML document, but are referred to the electronic PDF version and/or the original MMWR paper copy for the official text, figures, and tables. An original paper copy of this issue can be obtained from the Superintendent of Documents, U.S. Government Printing Office (GPO), Washington, DC 20402-9371; telephone: (202) 512-1800. Contact GPO for current prices. **Questions or messages regarding errors in formatting should be addressed to mmwrq@cdc.gov.Date last reviewed: 9/19/2007 |
|||||||||
|