|
|
|
|
|
|
|
| ||||||||||
|
|
|
|
|
|
|
||||
| ||||||||||
|
|
|
|
|
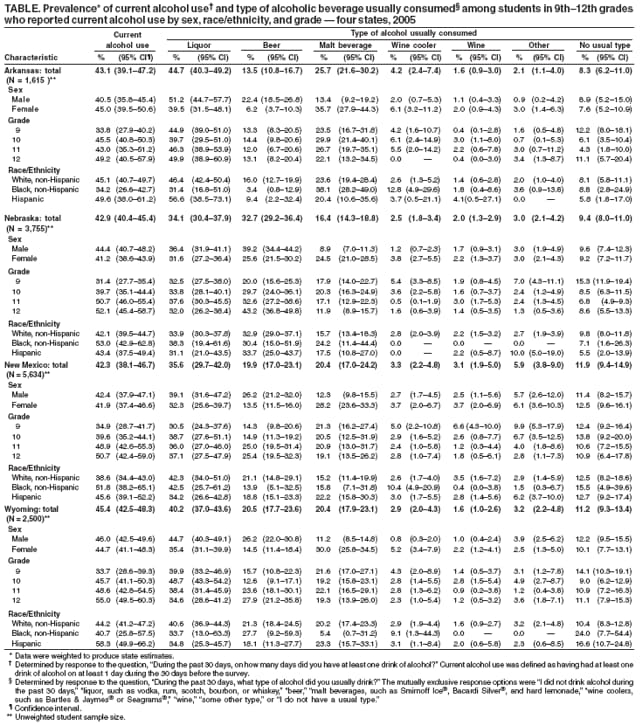
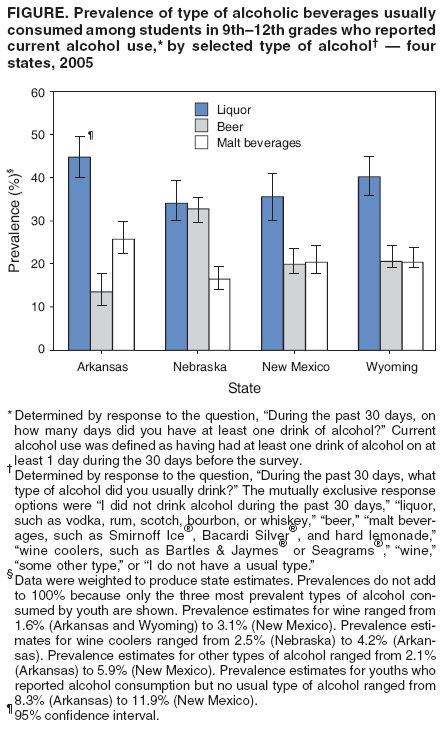
Persons using assistive technology might not be able to fully access information in this file. For assistance, please send e-mail to: mmwrq@cdc.gov. Type 508 Accommodation and the title of the report in the subject line of e-mail. Types of Alcoholic Beverages Usually Consumed by Students in 9th--12th Grades --- Four States, 2005Excessive alcohol consumption contributes to approximately 4,500 deaths* among underage youths in the United States each year (e.g., from homicides, motor-vehicle crashes, and suicides) and an average of 60 years of life lost per death (1). However, little is known about the specific types of alcoholic beverages consumed by youths.† These data are important because numerous evidence-based strategies for reducing underage drinking rates are beverage-specific, including increasing alcohol excise taxes and increasing restrictions on the distribution and sale of alcoholic beverages. To examine types of alcoholic beverages usually consumed by students in 9th--12th grades, CDC analyzed 2005 Youth Risk Behavior Survey (YRBS) data from the four state surveys that included a question on the type of alcohol consumed (Arkansas, Nebraska, New Mexico, and Wyoming). This report describes the results of that analysis, which indicated that liquor (e.g., bourbon, rum, scotch, vodka, or whiskey) was the most prevalent type of alcoholic beverage usually consumed among students in 9th--12th grades who reported current alcohol use or binge drinking. These findings suggest that considering beverage-specific alcohol consumption by youths is important when developing alcohol-control policies, specifically those related to the price and availability of particular types of alcoholic beverages. In 2005, Arkansas, Nebraska, New Mexico, and Wyoming conducted a YRBS using a two-stage cluster sample design to produce data representative of each state's public-school students in grades 9--12 (2). Students completed anonymous, self-administered, school-based questionnaires that included questions on health-risk behaviors including alcohol use and specific information on the type of alcoholic beverage usually consumed. The student sample sizes for the four states ranged from 1,615 (Arkansas) to 5,634 (New Mexico). School response rates ranged from 72% (Arkansas and Nebraska) to 94% (Wyoming), and student response rates ranged from 69% (New Mexico) to 93% (Nebraska), resulting in overall survey response rates ranging from 60% to 82%. Current alcohol use was defined as having had at least one drink of alcohol on at least 1 day during the 30 days before the survey.§ Binge drinking¶ was defined as having had five or more drinks of alcohol in a row on at least 1 day during the 30 days before the survey.** Type of alcohol usually consumed was defined as type of alcohol usually consumed during the 30 days before the survey††; the mutually exclusive response options were "I did not drink alcohol during the past 30 days," "liquor, such as vodka, rum, scotch, bourbon, or whiskey," "beer," "malt beverages, such as Smirnoff Ice®, Bacardi Silver®, and hard lemonade," "wine coolers, such as Bartles & Jaymes® or Seagrams®," "wine," "some other type," or "I do not have a usual type." Data were weighted to produce state estimates. Among students who reported current alcohol use or binge drinking during the 30 days before the survey, state-specific prevalence estimates for the type of alcohol usually consumed were calculated overall and by sex, grade, and race/ethnicity.§§ In 2005, the prevalence of current alcohol use among students in 9th--12th grades ranged from 42.3% in New Mexico to 45.4% in Wyoming (Table). In all four states, liquor was the most prevalent type of alcoholic beverage usually consumed among students who reported current alcohol use, ranging from 34.1% in Nebraska to 44.7% in Arkansas (Figure). The second most prevalent type of alcohol usually consumed was either beer or malt beverages (beer in Nebraska, malt beverages in Arkansas, and beer and malt beverages nearly equally in New Mexico and Wyoming). Wine was the least prevalent type of alcohol usually consumed in all four states, ranging from 1.6% in Arkansas and Wyoming to 3.1% in New Mexico. In all states but Nebraska, liquor was the most prevalent type of alcohol usually consumed among male students who reported current alcohol use (range: 39.1% in New Mexico to 51.2% in Arkansas), followed by beer (range: 22.4% in Arkansas to 26.2% in New Mexico and Wyoming). Beer was the most prevalent type among male students in Nebraska (39.2%), followed by liquor (36.4%). Among female students, liquor was the most prevalent type in all four states (range: 31.6% in Nebraska to 39.5% in Arkansas), followed by malt beverages in Arkansas, New Mexico, and Wyoming (range: 28.2% in New Mexico to 35.7% in Arkansas) and beer in Nebraska (25.6%). In all four grades, liquor was the most prevalent type of alcohol usually consumed among students who reported current alcohol use in all four states (range: 30.5% among 9th-grade students in New Mexico to 49.9% among 12th-grade students in Arkansas), except 12th-grade students in Nebraska, among whom beer was the most prevalent type usually consumed (43.2%). Liquor was the most prevalent type of alcohol usually consumed by students in all racial/ethnic groups in all four states, except black students in Arkansas (among whom malt beverages were the most prevalent) and Hispanic students in Nebraska (among whom beer was the most prevalent). The prevalence of binge drinking among all students ranged from 28.6% of students in New Mexico to 32.0% of students in Wyoming. Based on an analysis of the type of alcohol usually consumed among students in 9th--12th grades who reported binge drinking, liquor was the most prevalent type in all four states (49.1%, Arkansas; 37.2%, Nebraska; 41.0%, New Mexico; and 44.3%, Wyoming). Liquor was the most prevalent type of alcohol usually consumed among both male and female binge drinkers in Arkansas (55.8% and 42.9%, respectively), New Mexico (46.4% and 35.7%, respectively), and Wyoming (46.4% and 41.7%, respectively) and among female binge drinkers in Nebraska (36.6%). Beer was the most prevalent type of alcohol usually consumed among male binge drinkers in Nebraska (41.5%). Reported by: J Roeber, MSPH, DL Green, MPH, New Mexico State Health Dept; KM Meurer, PhD, New Mexico Public Education Dept. JJ Armitage, Office of Public Health, Nebraska Health and Human Svcs System. GM Maas, PhD, Wyoming Dept of Education; RC McClinton, MPH, Wyoming Dept of Health, Mental Health & Substance Abuse Svcs Div. K Courtney, MS, Arkansas Dept of Education. JL Cremeens, MSPH, RD Brewer, MD, Div of Adult and Community Health; JW Miller, MD, Div of Cancer Prevention and Control; D Eaton, PhD, Div of Adolescent School Health, National Center for Chronic Disease Prevention and Health Promotion, CDC. Editorial Note:This report provides the first state-specific analysis of types of alcoholic beverages consumed by high school students. In 2005, liquor was the most prevalent type of alcohol usually consumed by students in 9th--12th grades reporting current alcohol use and binge drinking in Arkansas, Nebraska, New Mexico, and Wyoming and also was the most prevalent type in most sex, grade, and racial/ethnic groups. The findings in this report might reflect an emerging trend in usual beverage consumed among underage drinkers that has been reported in other studies. Monitoring the Future (MTF), a national survey of 8th-, 10th-, and 12th-grade students, found that among 12th-grade students, the prevalence of liquor consumption during the 30 days before the survey was higher in 2005 (36.4%) than in 1990 (30.8%), whereas the prevalence of beer consumption during the 30 days before the survey was lower in 2005 (38.0%) than in 1990 (47.2%) (3). The MTF survey also indicated that among 12th grade students the prevalence of heavy liquor consumption (i.e., binge drinking with liquor [five or more drinks in a row]) during the 2 weeks before the survey was higher in 2005 (25.0%) than in 1990 (16.8%), whereas the prevalence of binge drinking with beer during the 2 weeks before the survey was lower in 2005 (22.4%) than in 1990 (27.0%) (3). In addition, recent studies have reported a substantial increase in liquor-specific marketing on cable television programs that have disproportionately large youth audiences (4). Several factors might play a role in students choosing liquor more than other types of alcoholic beverages. First, high school students have a high prevalence of binge drinking, which can lead to acute intoxication (5); liquor might facilitate this outcome because of the higher ethanol concentration. Second, liquor can be combined with other beverages such as soft drinks, possibly making concealment easier and providing a flavor that is more acceptable to younger drinkers. These same factors also might cause youths to unintentionally drink more alcohol and drink it in a shorter period (6), increasing the risk for alcohol-related effects (e.g., alcohol poisoning). The findings in this report are subject to at least three limitations. First, the alcohol-consumption patterns of students in 9th--12th grades in the four states studied might not be representative of the drinking patterns of students throughout the United States. However, the prevalence of current alcohol use and binge drinking among students in these states is similar to national estimates (2). Second, these data are from students who attend public schools and therefore might not be representative of all youths in these grades, including those who attend alternative schools, or persons who do not attend school; students who attend alternative schools might have even higher rates of alcohol use (7). Finally, all prevalence estimates are based on self-reports and might be subject to recall bias (8). Surveillance on beverage-specific consumption among youths can be useful in planning prevention strategies for underage drinking that specifically target specific beverage types. For example, surveillance data could be used to better focus measures to reduce youth exposure to alcohol advertising and retail access to alcoholic beverages and to monitor the effectiveness of these strategies by type of beverage. These data also underscore the need to continue the use of evidence-based strategies to reduce youth drinking. Previous studies have indicated that certain strategies are effective, including improved enforcement of minimum legal purchasing-age laws (e.g., through compliance checks in which minors or youthful-looking adults attempt to purchase alcohol from retail establishments) (9) and increased alcohol excise taxes (10). References
* This estimate includes conditions that specifically affect persons aged <21 years (e.g., child maltreatment, fetal alcohol syndrome, and low birthweight) that are the result of alcohol consumption by someone else (e.g., a parent or guardian). † The minimum legal age at which persons can purchase alcohol is 21 years in all 50 U.S. states. § Determined by response to the question, "During the past 30 days, on how many days did you have at least one drink of alcohol?" ¶ The variable "binge drinking" has been reported as "episodic heavy drinking" in previous reports using YRBS data. ** Determined by response to the question, "During the past 30 days, on how many days did you have 5 or more drinks of alcohol in a row, that is, within a couple of hours?" †† Determined by response to the question, "During the past 30 days, what type of alcohol did you usually drink?" §§ Students who indicated that they had not drunk alcohol during the 30 days preceding the survey in response to either the current alcohol use question or the type of alcohol usually consumed question were excluded from the analyses.
Table
Disclaimer All MMWR HTML versions of articles are electronic conversions from ASCII text into HTML. This conversion may have resulted in character translation or format errors in the HTML version. Users should not rely on this HTML document, but are referred to the electronic PDF version and/or the original MMWR paper copy for the official text, figures, and tables. An original paper copy of this issue can be obtained from the Superintendent of Documents, U.S. Government Printing Office (GPO), Washington, DC 20402-9371; telephone: (202) 512-1800. Contact GPO for current prices. **Questions or messages regarding errors in formatting should be addressed to mmwrq@cdc.gov.Date last reviewed: 7/26/2007 |
|||||||||
|