 |
|
|
|
|
|
|
| ||||||||||
|
|
|
|
|
|
|
||||
| ||||||||||
|
|
|
|
|
Persons using assistive technology might not be able to fully access information in this file. For assistance, please send e-mail to: mmwrq@cdc.gov. Type 508 Accommodation and the title of the report in the subject line of e-mail. Racial/Ethnic Disparities in Diagnoses of HIV/AIDS --- 33 States, 2001--2004In 2003, an estimated 1.2 million persons in the United States were living with human immunodeficiency virus (HIV) infection, 47% of whom were non-Hispanic blacks* (1) . This report describes racial/ethnic disparities in diagnoses of HIV/acquired immunodeficiency syndrome (AIDS) during 2001--2004 and reported to CDC through June 2005 by 33 states† that used confidential, name-based reporting of HIV and AIDS cases for at least 4 years. Of the estimated 157,252 diagnoses of HIV infection, the number of cases and diagnosis rates among blacks were higher than those for all other racial/ethnic populations combined. Among males, blacks had the largest or second-largest percentage of cases in every transmission category; among females, blacks had the largest percentage of cases in all transmission categories. Moreover, among both males and females, blacks represented the largest percentage of HIV/AIDS diagnoses in every age group. New and improved prevention strategies, including expanded HIV testing, targeted communications, and tailored prevention services, are needed to help address disparities in HIV transmission among blacks. Cases of HIV and AIDS were analyzed together as HIV/AIDS (i.e., HIV infection with or without AIDS) and counted by year of earliest reported diagnosis of HIV infection. Adult cases were classified into the following hierarchy of transmission categories: 1) male-to-male sexual contact (men who have sex with men [MSM]), 2) injection-drug use (IDU), 3) both male-to-male sexual contact and injection-drug use (MSM/IDU), 4) high-risk heterosexual contact (i.e., with a person of the opposite sex known to have HIV/AIDS or a risk factor [e.g., MSM or IDU] for HIV/AIDS), and 5) all other risk factors combined. Pediatric cases were classified as either perinatal transmission or all other transmission categories combined. The number of HIV/AIDS diagnoses, rates per 100,000 population, and estimated annual percentage change (EAPC) (with associated 95% confidence intervals [CIs]) were calculated. Data were adjusted for reporting delays and redistribution of risk among persons initially reported without sufficient information to classify them into a transmission category (2). Although blacks accounted for approximately 13% of the population of the 33 states during 2001--2004 (3), they accounted for the majority (80,187 [51%]) of HIV/AIDS diagnoses. Blacks accounted for the greatest percentage of cases diagnosed among males (44%) and the majority of cases among females (68%) (4). Among males, 36% of MSM cases, 54% of IDU cases, 39% of MSM/IDU cases, and 66% of high-risk heterosexual contact cases were in blacks. Among females, 70% of high-risk heterosexual contact cases and 60% of IDU cases were in blacks. Moreover, 69% of cases of perinatal transmission were among blacks. Average annual rates of HIV diagnoses for specific transmission categories were calculated using race/ethnicity- and age-specific census data as the denominators. For example, the rate of cases among blacks with male-to-male sexual contact represents the number of cases among black MSM per 100,000 black males during 2001--2004. Blacks had the highest average rates for all transmission categories. For cases among MSM, the rate for blacks was 69.0 per 100,000, compared with 13.9 for whites, 37.8 for Hispanics, 8.2 for Asians/Pacific Islanders (A/PIs), and 12.1 for American Indians/Alaska Natives (AI/ANs). For cases among males reporting IDU, the rate for blacks was 26.9 per 100,000, compared with 1.7 for whites, 12.0 for Hispanics, 1.6 for A/PIs, and 2.7 for AI/ANs. For cases among males with high-risk heterosexual contact, the rate for blacks was 35.5 per 100,000, compared with 1.1 for whites, 10.9 for Hispanics, 2.3 for A/PIs, and 2.4 for AI/ANs. For cases among females reporting IDU, the rate for blacks was 14.2 per 100,000, compared with 1.0 for whites, 4.8 for Hispanics, 0.6 for A/PIs, and 2.2 for AI/ANs. For cases among females with high-risk heterosexual contact, the rate for blacks was 58.3 per 100,000, compared with 2.2 for whites, 15.0 for Hispanics, 2.8 for A/PIs, and 5.3 for AI/ANs. EAPC was used as a measure of the change in HIV diagnosis rates from 2001 to 2004. Among males (Figure 1), EAPC for blacks was -4.4 (CI = -8.4---0.3), for whites was 1.4 (CI = -3.3--6.4), for Hispanics was -4.7 (CI = -11.2--2.3), for A/PIs was 8.1 (CI = 1.8--14.7), and for AI/ANs was 2.4 (CI = -6.4--12.1). Among females (Figure 2), EAPC for blacks was -6.8 (CI = -9.8---3.7), for whites was -2.1 (CI = -8.2--4.3), for Hispanics was -13.0 (CI = -19.7---5.7), for A/PIs was 14.3 (CI = 3.4--26.4), and for AI/ANs was 4.8 (CI = -26.3--49.1). Although the annual percentage decrease in HIV diagnosis rates among blacks was statistically significant (p<0.05), the annual HIV diagnosis rates among both black males and females remained higher than the rates for all other racial/ethnic populations. In 2004, among males, the rate of HIV/AIDS diagnosis for blacks (131.6 per 100,000) was 7.0 times higher than that for whites (18.7 per 100,000), 2.2 times higher than that for Hispanics (60.2 per 100,000), 9.5 times higher than that for A/PIs (13.9 per 100,000), and 6.3 times higher than that for AI/ANs (20.8 per 100,000). Among females, the HIV/AIDS diagnosis rate for blacks (67.0 per 100,000) was 20.9 times higher than the rate for whites (3.2 per 100,000), 4.1 times higher than the rate for Hispanics (16.3 per 100,000), 16.3 times higher than for A/PIs (4.1 per 100,000), and 8.7 times higher than for AI/ANs (7.7 per 100,000) (5). The rate among black females was higher than rates among males in any other racial/ethnic population. By region,§ blacks accounted for the majority of diagnoses in the South (47,497 [54%]) and Northeast (23,674 [53%]). Black males accounted for more HIV/AIDS diagnoses than males of any other racial/ethnic population in the South (29,532 [48%]) and the Northeast (14,104 [47%]). Black females accounted for the majority of HIV/AIDS diagnoses among females in the South (17,965 [72%]), Northeast (9,570 [65%]), and Midwest (2,565 [64%]) (Table). Reported by: J Prejean, PhD, AJ Satcher, MPH, T Durant, PhD, X Hu, MS, LM Lee, PhD, Div of HIV/AIDS Prevention, National Center for HIV, STD, and TB Prevention, CDC. Editorial Note:During 2001--2004, in nearly every demographic and transmission category, the largest percentages of HIV/AIDS cases diagnosed were among blacks. Disparities were observed in all demographic and transmission groups; however, the disparity was especially pronounced among women, children, and persons with high-risk heterosexual contact. Blacks accounted for the highest percentages and rates of cases for both males and females in the high-risk heterosexual contact transmission category and for the majority of cases of HIV attributed to perinatal transmission (5). During 2001--2004, the most common mode of transmission for HIV infection for both black males and females was sex with a man. The National HIV Behavioral Surveillance System (NHBS) surveyed MSM who frequented MSM-identified venues (e.g., bars, street locations, dance clubs, cafés, retail stores, gay pride events, social organizations, gyms, sex clubs, and parks) in five U.S. cities. Forty-six percent of black MSM in the study were HIV positive; of those, 67% were unaware of their HIV status (6). High-risk heterosexual contact is the main route of HIV transmission among black females and the second most common route among black males. Continuing high rates of HIV infection among blacks underscore the need for effective, culturally tailored HIV-prevention strategies, including outreach testing strategies for identifying persons with undiagnosed HIV infection. The findings in this report are subject to at least three limitations. First, confidential, name-based HIV/AIDS surveillance was not conducted in all 50 states and U.S. territories. The 33 states included in this analysis accounted for 63% of the national total of AIDS diagnoses (excluding U.S. territories) and might not be nationally representative. Data from several areas with high AIDS morbidity (e.g., California, Illinois, and the District of Columbia) were not included. However, the racial/ethnic disparities described in this report are similar to the disparities observed in AIDS cases from all 50 states (5). Second, classification of cases with no identified risk factor was based on follow-up investigations; those cases were assumed to constitute a representative sample of all cases initially reported without a risk factor. Finally, this analysis was not constructed with age-specific subgroups, in which different trends in HIV/AIDS diagnosis rates might be observed. A comprehensive national program is required to address the substantial racial disparities in HIV/AIDS diagnoses in the United States described in this report. To reduce disparities, partnerships must be enhanced among a broad range of persons and groups, including governmental agencies, community organizations, faith-based institutions, educational institutions, community opinion leaders, and the public. Through Minority AIDS Initiative funding, CDC has funded prevention programs aimed at reducing the disparity in HIV/AIDS diagnoses nationally. As part of this effort, CDC's Advancing HIV Prevention (AHP) initiative is aimed at reducing barriers to early diagnosis of HIV and at increasing access to quality medical care, treatment, and ongoing prevention services for HIV-infected persons. Through AHP, CDC has introduced programs (e.g., HIV testing and sex network demonstration projects) to increase HIV testing among populations at risk for HIV infection (7) and has proposed revisions to HIV-testing recommendations to include routine HIV testing of adults, adolescents, and pregnant women in health-care settings (7,8). In addition, CDC, in collaboration with state and local health departments and community-based organizations, continues to promote effective HIV-prevention interventions that target persons who are at high risk for HIV infection (9). Ensuring that these programs are broadly accessible to blacks living in disadvantaged areas, including urban areas and the rural South, is critical. In 2005, CDC established an African American Working Group to develop a comprehensive action plan to increase and strengthen HIV/AIDS and sexually transmitted disease (STD) prevention activities for blacks who are at high risk for infection. Moreover, CDC is working to engage partner organizations from various backgrounds and disciplines, including educational institutions, researchers, state and local health departments, community-based organizations, faith-based programs, and AIDS services organizations, to address HIV/AIDS and STD prevention concerns among blacks in the United States. References
§ Northeast: New Jersey and New York. Midwest: Indiana, Iowa, Kansas, Michigan, Minnesota, Missouri, Nebraska, North Dakota, Ohio, South Dakota, and Wisconsin. South: Alabama, Arkansas, Florida, Louisiana, Mississippi, North Carolina, Oklahoma, South Carolina, Tennessee, Texas, Virginia, and West Virginia. West: Alaska, Arizona, Colorado, Idaho, Nevada, New Mexico, Utah, and Wyoming. * For this report, persons identified as white, black, Asian/Pacific Islander, American Indian/Alaska Native, or of other/unknown race are all non-Hispanic. Persons identified as Hispanic might be of any race. † Alabama, Alaska, Arizona, Arkansas, Colorado, Florida, Idaho, Indiana, Iowa, Kansas, Louisiana, Michigan, Minnesota, Mississippi, Missouri, Nebraska, Nevada, New Jersey, New Mexico, New York, North Carolina, North Dakota, Ohio, Oklahoma, South Carolina, South Dakota, Tennessee, Texas, Utah, Virginia, West Virginia, Wisconsin, and Wyoming. Figure 1 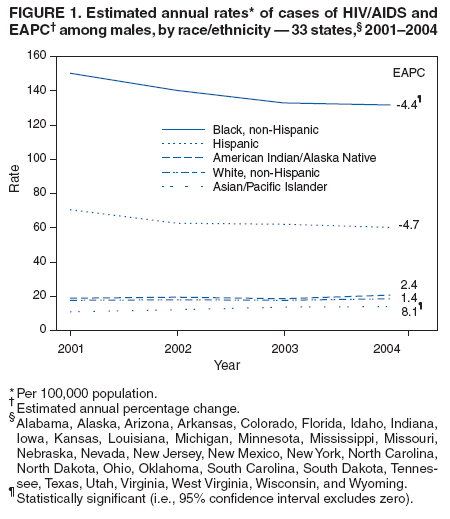 Return to top. Figure 2 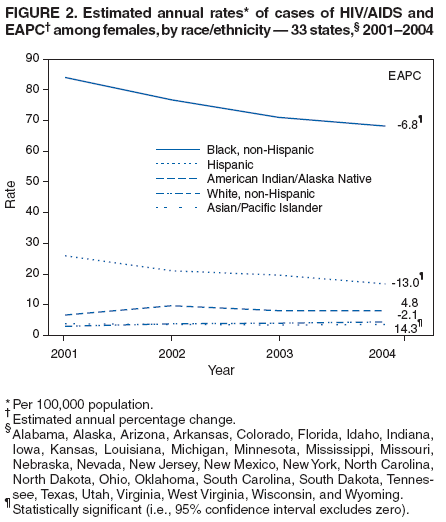 Return to top. Table 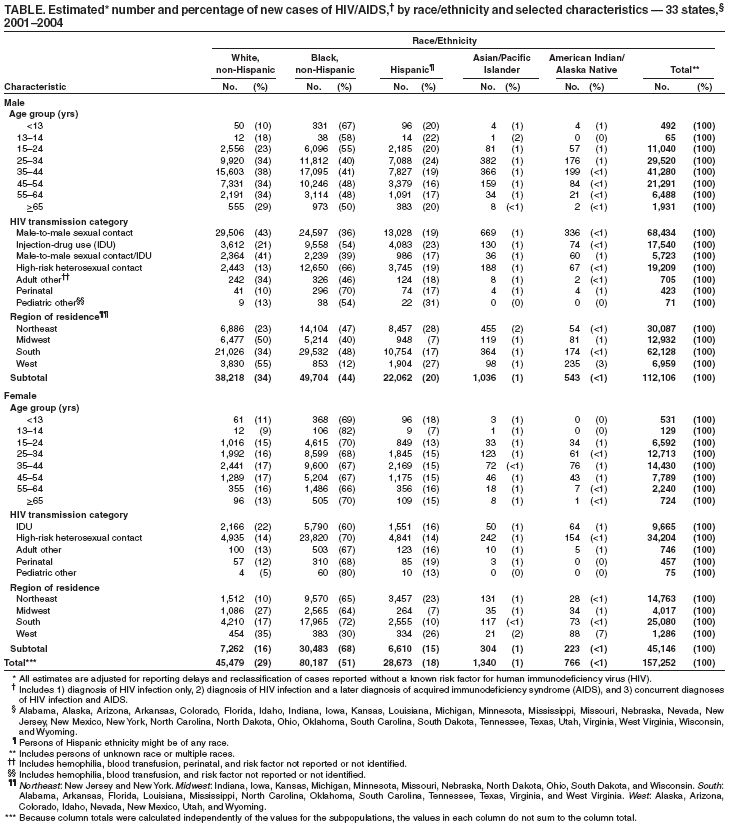 Return to top.
Disclaimer All MMWR HTML versions of articles are electronic conversions from ASCII text into HTML. This conversion may have resulted in character translation or format errors in the HTML version. Users should not rely on this HTML document, but are referred to the electronic PDF version and/or the original MMWR paper copy for the official text, figures, and tables. An original paper copy of this issue can be obtained from the Superintendent of Documents, U.S. Government Printing Office (GPO), Washington, DC 20402-9371; telephone: (202) 512-1800. Contact GPO for current prices. **Questions or messages regarding errors in formatting should be addressed to mmwrq@cdc.gov.Date last reviewed: 2/8/2006 |
|||||||||
|