|
|
|
|
|
|
|
| ||||||||||
|
|
|
|
|
|
|
||||
| ||||||||||
|
|
|
|
|
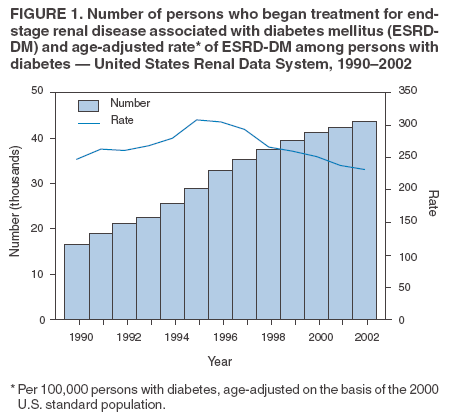
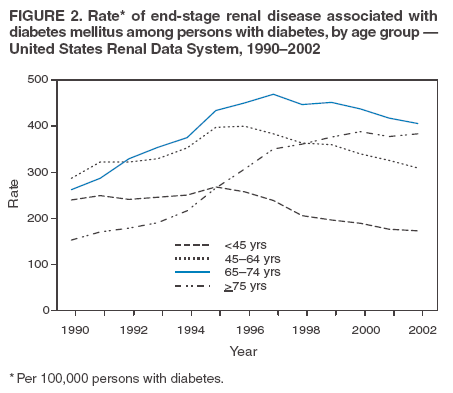
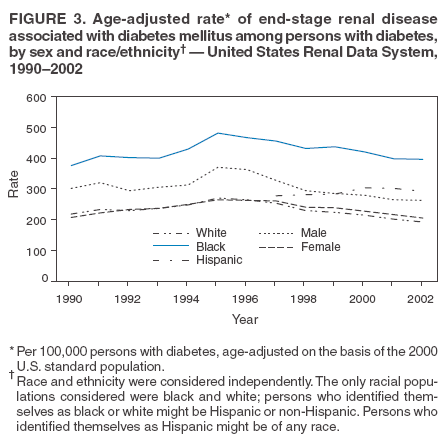
Persons using assistive technology might not be able to fully access information in this file. For assistance, please send e-mail to: mmwrq@cdc.gov. Type 508 Accommodation and the title of the report in the subject line of e-mail. Incidence of End-Stage Renal Disease Among Persons With Diabetes --- United States, 1990--2002Diabetes mellitus is the leading cause of end-stage renal disease (ESRD) (i.e., kidney failure requiring dialysis or transplantation) in the United States, accounting for 44% of new cases of treated ESRD in 2002 (1). To examine trends in ESRD attributed to diabetes mellitus (ESRD-DM) in the United States, CDC analyzed 1990--2002 data from the United States Renal Data System (USRDS) and the National Health Interview Survey (NHIS). This report summarizes the findings of that analysis, which indicated that, although the number of new cases of ESRD-DM increased overall, the incidence of ESRD-DM among persons with diabetes is not increasing among blacks,* Hispanics, men, and persons aged 65--74 years, and is declining among persons aged <65 years, women, and whites. Continued interventions to reduce the prevalence of risk factors for kidney disease and improve diabetes care are needed to sustain and improve these trends. USRDS, which is funded by the National Institute of Diabetes and Digestive and Kidney Diseases of the National Institutes of Health (NIH), collects, analyzes, and distributes information from clinical and claims data reports to the Centers for Medicare and Medicaid Services (CMS) regarding patients being treated for ESRD. With the ESRD entitlement program, the CMS Medicare program reimburses most of the total cost of ESRD treatment in the United States (1). USRDS collects demographic data and ESRD-related information, such as the date patients were first treated and the primary cause of their renal failure. CDC determined the number of persons who began treatment (i.e., dialysis or kidney transplantation) for ESRD in the United States during 1990--2002 for whom diabetes was the primary cause of renal failure. Incidence was calculated from 3-year moving averages of the annual number of U.S. residents with diabetes, as estimated by NHIS data for a weighted sample of the civilian noninstitutionalized population and age-adjusted on the basis of the 2000 U.S. standard population. In 1996, the NHIS estimate of the number of U.S. residents with diabetes was unusually low† (2), resulting in ESRD-DM incidence that was higher than expected. Beginning in 1997, data on Hispanics were collected, and the NHIS survey methodology was changed; instead of asking a one-sixth subsample of respondents whether (during the preceding 12 months) a family member had diabetes, all respondents were asked whether a health professional had ever told them they had diabetes (3). All analyses were conducted using statistical analysis software to account for the complex NHIS survey design. Regression analyses of annual data were used to test for trends; these analyses were performed both with and without the 1996 data. The number of persons who began treatment for ESRD-DM increased 162%, from 16,649 in 1990 to 43,638 in 2002 (Figure 1). The age-adjusted incidence of ESRD-DM increased from 247 per 100,000 persons with diabetes in 1990 to 305 in 1996, before declining 21%, from 293 in 1997 to 232 in 2002 (p<0.01) (Figure 1). However, the magnitude of this decline in ESRD-DM incidence varied by age group (Figure 2). During 1997--2002, incidence decreased for persons aged <65 years (by 28% for those aged <45 years [p<0.01] and by 19% for those aged 45--64 years [p<0.05]); however, incidence did not change significantly for those aged 65--74 years, and increased 10% for those aged >75 years (p<0.05). The magnitude of change in ESRD-DM incidence also differed by sex and by race/ethnicity (Figure 3). During 1990--2002, age-adjusted ESRD-DM incidence was greater among men than women and higher among blacks than whites. During 1997--2002, age-adjusted ESRD-DM incidence decreased significantly among women (p<0.05) but not among men. Incidence also decreased significantly among whites (p<0.01) but not among blacks; the trend among Hispanics did not change significantly. Reported by: NR Burrows, MPH, J Wang, LS Geiss, MA, KM Venkat Narayan, MD, MM Engelgau, MD, Div of Diabetes Translation, National Center for Chronic Disease Prevention and Health Promotion, CDC. Editorial Note:ESRD is a costly and disabling condition that disproportionately affects racial/ethnic minority populations and is associated with a high mortality rate (1). Risk factors for ESRD-DM include familial and genetic factors, the length of time a person has had diabetes, and hyperglycemia, hypertension, and hyperlipidemia (4). The findings in this report indicate encouraging trends in ESRD-DM incidence. After increasing from 1990 to 1996, ESRD-DM incidence decreased during 1997--2002 among persons aged <65 years, women, and whites; stopped increasing among persons aged 65--74 years, men, and blacks; and remained level among Hispanics. The reasons for improvement cannot be determined from these surveillance data; however, they might include a reduction in the prevalence of cardiovascular disease risk factors such as high blood pressure and high cholesterol (5), improvements in diabetes care practices (6), or development of new pharmacologic agents to reduce the prevalence of kidney disease risk factors (7). Continued interventions (e.g., blood sugar and blood pressure control [8--10]) to reduce the prevalence of these risk factors and improve care among persons with diabetes are needed to sustain and improve trends in ESRD-DM incidence. During 1997--2002, ESRD-DM incidence among men, blacks, persons aged 65--74 years, and Hispanics did not decrease as it did among certain other populations; among persons aged >75 years, ESRD-DM incidence increased during 1990--2002. Additional strategies are needed to reduce these disparities. Reducing incidence of ESRD-DM among persons aged >75 years likely will be difficult because persons with diabetes are surviving longer and ESRD typically occurs 15--20 years after onset of diabetes (4). Moreover, the number of ESRD cases in the United States is likely to continue to increase as the U.S. population ages and the number of persons with diabetes continues to increase. The downward trend in ESRD incidence in the population with diabetes might reverse if persons have diabetes at younger ages or live with the disease for a longer time, thus increasing their risk for developing ESRD. The findings in this report are subject to at least four limitations. First, data were collected for patients whose ESRD treatment was reported to CMS and do not include patients who died from ESRD before receiving treatment, persons who refused treatment, or patients whose treatment was not reported to CMS. Second, the 1996 NHIS estimate of the number of U.S. residents with diabetes was unusually low (2); however, exclusion of 1996 data did not substantially affect incidence trends. Third, because incidence of ESRD-DM was defined as the percentage of persons with diabetes who began ESRD treatment in a given year, changes in incidence might have been caused by other factors, such as changes in diabetes treatment and care practices, greater recognition of the etiologic role of diabetes in ESRD, changes in access to treatment or acceptance of ESRD treatment, or a combination of these factors. Finally, the correlation between the length of time diabetes patients had the disease and their risk for developing ESRD-DM was not assessed because of a lack of data on duration of diabetes. CDC provides resources and technical assistance to state and territorial diabetes-control programs to help them 1) educate persons regarding diabetes, 2) improve and monitor the quality of diabetes care, and 3) promote early detection of diabetic complications. The National Diabetes Education Program (NDEP), sponsored by CDC and NIH, aims to educate the public about controlling diabetes and preventing its complications. The NDEP campaign, "Know your ABCs,"§ addresses risk factors for ESRD-DM, such as hyperglycemia, hypertension, and hyperlipidemia. In addition, the National Kidney Disease Education Program,¶ sponsored by NIH, seeks to raise public awareness about the seriousness of kidney disease, the importance of testing for kidney disease among those at risk, and the availability of treatment to prevent or slow kidney failure. Similarly, the National Kidney Foundation offers the Kidney Early Evaluation Program,** a free health-screening program for persons at increased risk for kidney disease. CDC will continue to work with public and private partners to reduce rates of diabetes and other risk factors for kidney disease and to improve care for persons with diabetes. Continued surveillance of ESRD-DM, its risk factors, and the level of care received by patients with diabetes will help public health officials monitor and assess progress in reducing the incidence of this serious complication of diabetes. References
* For this report, race and ethnicity were considered independently. The only racial populations considered were black and white; persons who identified themselves as black or white might be Hispanic or non-Hispanic. Persons who identified themselves as Hispanic might be of any race. † Relative to 1995, the 1996 NHIS sample size was reduced by approximately 25% in the first and second quarters and by approximately 50% in the third and fourth quarters. § Available at http://www.cdc.gov/diabetes/ndep/campaigns.htm. ¶ Available at http://www.nkdep.nih.gov. ** Available at http://www.kidney.org/keep.
Figure 1
Disclaimer All MMWR HTML versions of articles are electronic conversions from ASCII text into HTML. This conversion may have resulted in character translation or format errors in the HTML version. Users should not rely on this HTML document, but are referred to the electronic PDF version and/or the original MMWR paper copy for the official text, figures, and tables. An original paper copy of this issue can be obtained from the Superintendent of Documents, U.S. Government Printing Office (GPO), Washington, DC 20402-9371; telephone: (202) 512-1800. Contact GPO for current prices. **Questions or messages regarding errors in formatting should be addressed to mmwrq@cdc.gov.Date last reviewed: 11/2/2005 |
|||||||||
|