|
|
|
|
|
|
|
| ||||||||||
|
|
|
|
|
|
|
||||
| ||||||||||
|
|
|
|
|
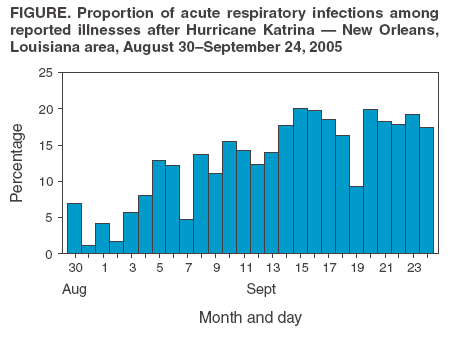
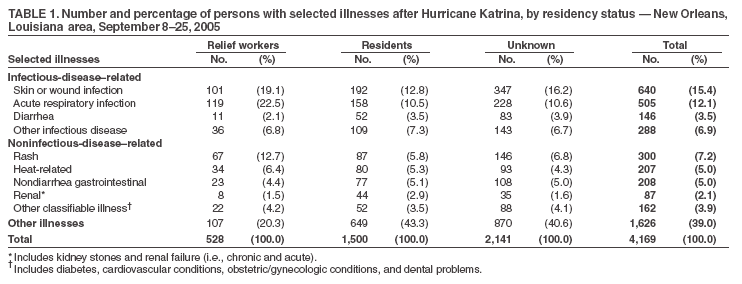
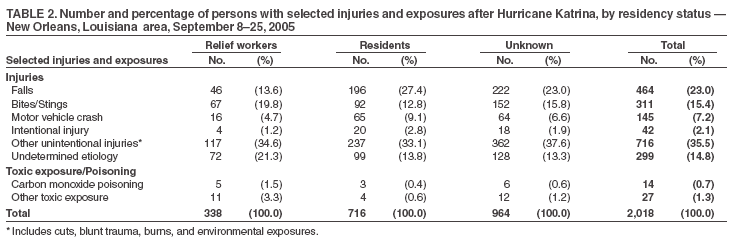
Persons using assistive technology might not be able to fully access information in this file. For assistance, please send e-mail to: mmwrq@cdc.gov. Type 508 Accommodation and the title of the report in the subject line of e-mail. Surveillance for Illness and Injury After Hurricane Katrina --- New Orleans, Louisiana, September 8--25, 2005Hurricane Katrina struck the Gulf Coast on August 29, 2005, resulting in extensive structural damage and severe flooding from breached levees in and around New Orleans, Louisiana. The public health infrastructure of the Louisiana Department of Health and Hospitals (LDHH) was damaged extensively, limiting surveillance for illnesses, injuries, and toxic exposures. On September 9, 2005, LDHH, CDC, and functioning emergency treatment resources (i.e., hospitals, disaster medical assistance teams, and military aid stations) established an active surveillance system to detect outbreaks of disease and characterize post-hurricane injuries and illnesses (1,2). As of September 25, the system had monitored 7,508 reports of health-related events* at participating facilities. Trends observed in the data prompted investigations of respiratory and rash illnesses, but no major outbreaks of disease or hazardous environmental exposures were detected.These data also were used to identify post-hurricane injury patterns and to guide prevention messages to residents and relief workers. A natural disaster of the magnitude of Hurricane Katrina requires a sustained response and a detailed plan for return to pre-hurricane surveillance activities. The target population for the surveillance system was persons living or working in four parishes in and around New Orleans (Jefferson, Orleans, Plaquemines, and St. Bernard). On September 9, active surveillance was initiated in three hospitals and five nonhospital facilities that were providing acute care in these four parishes. Two additional hospitals and six additional nonhospital facilities in neighboring parishes that were treating workers and residents from the affected area also were enrolled in the surveillance system. As of September 25, four hospitals and 10 nonhospital facilities were participating in the surveillance system. The facilities used a standardized reporting form that gathered individual level data on demographics, symptoms, clinical impressions (e.g., dehydration, acute respiratory infection [ARI], or diarrhea) and mechanism of injury (e.g., motor vehicle crash, laceration, fall, bite, or sting). In most facilities, health-care providers completed the form; in facilities with high volume, team members were assigned to assist with data abstraction from current medical records. Abstractors and clinicians were asked to identify all events as injury, illness, injury and illness, medication refill, or follow-up visit. All data were gathered and entered into a computer database manually and analyzed daily. Illness and injury trends or individual cases of selected illness (e.g., bloody diarrhea or ARI) were communicated to city and state health authorities and investigated by health teams when appropriate. Data were gathered prospectively starting September 9, 2005. Retrospective data have been collected when available, with a goal of complete enumeration from August 27, 2005, forward. Percentage estimates for each illness or injury were calculated by dividing the number of persons with a specific condition by all persons with an illness or injury, respectively. For 146 (1.9%) persons, both an illness and injury were recorded. During September 8--25, 2005, a total of 7,508 events were recorded; 4,169 (55.6%) were illnesses, and 2,018 (26.9%) were injuries (Tables 1 and 2). Another 1,321 (17.5%) were nonacute health-related events, not classified as either illnesses or injuries (e.g., medication refills, wound checks, or cast removals). Of the 6,167 illnesses and injuries where disposition status was known, five persons died, and 552 (9%) were admitted to hospitals. Among those injured, 42 had intentional injuries (i.e., self-inflicted or violent), seven of those (16.7%) were victims of assault, and one (2.4%) was admitted to a health-care facility. A total of 1,037 (13.8%) events were recorded for relief workers (e.g., paid military, paid civilian, self-employed, or volunteer), and 2,567 (34.2%) events were recorded for residents (i.e., persons not identified as relief workers). For 3,904 (52.0%) persons, relief worker status or resident status was unknown. Relief workers were significantly more likely than residents aged >18 years to be treated in a nonhospital facility (odds ratio [OR] = 5.8, 95% confidence interval [CI] = 5.0--6.8). The proportion of ill patients evaluated for ARI increased over time, during September 8--25, when data were analyzed from all facilities (Figure). Among the 505 with ARI, 371 (73.5%) had cough, 62 (12.3%) had shortness of breath, and 60 (11.2%) had fever. A total of 23 (4.6%) persons with ARI were admitted to a hospital. When separate analyses were performed by type of facility (i.e., hospital versus nonhospital), the increase in ARI cases over time was only observed in nonhospital facilities. Investigation determined that this trend was driven by one facility that identified multiple ARI cases among members of a National Guard battalion. Rash illnesses increased over time in all facilities. Relief workers were significantly more likely than residents to be seen for a rash (OR = 1.7, CI = 1.4--2.1). Investigations determined that these rashes were noninfectious; they were classified as prickly heat, arthropod bites, and the abrasive effects of wet clothing and moist skin (3). Motor vehicle crashes accounted for 145 (7.2%) of the injuries; motor vehicle crashes accounted for a smaller proportion of injuries among relief workers (5.0%) than among residents (9.2%) (OR = 0.55, CI = 0.32--0.95). As of September 25, the surveillance system had detected 14 cases of carbon monoxide (CO) poisoning; 27 persons were exposed to other toxic substances (e.g., diesel fuel, contaminated water, or cleaning agents). Reported by: W Willams, MD, Northshore Regional Medical Center; J Guarisco, Ochsner Hospital; K Guillot, St. Charles Parish Hospital; J Wales, MD, East Jefferson Medical Center; C Revels, West Jefferson Medical Center; G Barre, MD, Ochsner Clinic Foundation; K Stevens, MD, City of New Orleans Health Dept; R Ratard, MD, S Straif-Bourgeois, PhD, T Sokel, MPH, Office of Public Health, Louisiana Dept of Health and Hospitals. CDC Greater New Orleans Public Health Response Team; C Brown, MS, National Immunization Program; M Gershman, MD, J Grant, MD, N Kazerounie, PhD, G Mirchandi, PhD, R Novak, PhD, A Parker, MPH, M Riggs, PhD, A Sharma, PhD, L Sosa, MD, A Sumner, MD, C Tabak, MD, P Vranken, DPh, E Weiss, MD, R Bossarte, PhD, S Russell, MSN, MPH, EIS officers. Editorial Note:The loss of public health infrastructure from Hurricane Katrina necessitated rapid mobilization of resources in Louisiana to restore essential services and disease surveillance. In collaboration with LDHH, CDC established active surveillance in multiple settings, including evacuation centers, coroner offices, and hospital-based emergency departments to identify outbreaks, injuries, and environmental concerns and to initiate interventions before reinstitution of routine surveillance. Collection of individual-level data provided detailed contextual information (e.g., location or circumstances) regarding health-related events. No major outbreak of disease was reported in the greater New Orleans area. Although outbreaks of epidemic-prone diseases such as cholera have happened after extensive flooding in developing countries (4), the United States has low or no endemic potential for epidemics of cholera or measles (5). The surveillance system did identify an increase in ARI over time. This finding prompted an investigation into possible etiologies, including environmental exposure. Examination of individual data determined that the cluster was the result of transmission within close quarters of one battalion of the National Guard (6). Investigation also indicated that the rash illnesses were noninfectious. Injury data (e.g., proportion of motor vehicle crashes, falls, bites, and CO poisonings) were used to guide prevention messages (e.g., flyers distributed at health-care facilities and at checkpoints for residents returning to hurricane-affected areas) (7). The findings in this report are subject to at least three limitations. First, because of limited resources and heavy patient volume, the enumeration of illnesses and injuries among residents and relief workers in the New Orleans area after Hurricane Katrina is incomplete. Second, misclassification of illnesses or injuries on the standardized form by participating facilities was possible. Finally, prehurricane baseline data were not available to assess the magnitude of any increase in illnesses and injuries. Written protocols were established and training was provided for each team deployed to ensure continuity of the surveillance system. Goals for the surveillance system, inclusion and exclusion criteria for reporting facilities, protocols for facility recruitment, data analysis methodology, and thresholds to initiate outbreak investigations all require documentation and review by stakeholders. The evacuation of New Orleans associated with Hurricane Katrina created unforeseen complications in establishing and maintaining the surveillance system. Manual data collection and entry on this scale required substantial personnel resources and increased institutional support as residents returned to the four parishes. When providing surveillance support after a disaster of this magnitude, authorities should be prepared to devote resources to the collection and reporting of data, implement automated data entry (e.g., scannable forms and electronic transmission of medical records) at the earliest opportunity, and reinstitute prehurricane surveillance once the capacity of the state health department has been reestablished. Acknowledgments This report is based, in part, on contributions by G Fisher, Federal Emergency Management Agency; D Diamond, MD, Northwest Medical Teams International; Medical Response Unit of the US National Guard; S Hartley, J Johnston, G Nelson, US Geological Survey. References
* Defined as a reported clinical impression for illness or mechanism of injury for injuries, toxic exposures, or carbon monoxide poisonings.
Disclaimer All MMWR HTML versions of articles are electronic conversions from ASCII text into HTML. This conversion may have resulted in character translation or format errors in the HTML version. Users should not rely on this HTML document, but are referred to the electronic PDF version and/or the original MMWR paper copy for the official text, figures, and tables. An original paper copy of this issue can be obtained from the Superintendent of Documents, U.S. Government Printing Office (GPO), Washington, DC 20402-9371; telephone: (202) 512-1800. Contact GPO for current prices. **Questions or messages regarding errors in formatting should be addressed to mmwrq@cdc.gov.Date last reviewed: 10/13/2005 |
|||||||||
|