|
|
|
|
|
|
|
| ||||||||||
|
|
|
|
|
|
|
||||
| ||||||||||
|
|
|
|
|
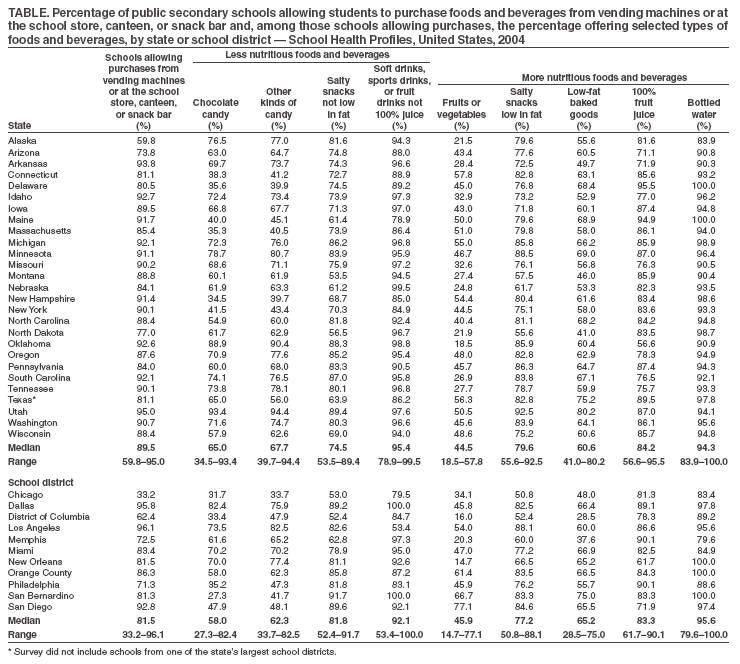
Persons using assistive technology might not be able to fully access information in this file. For assistance, please send e-mail to: mmwrq@cdc.gov. Type 508 Accommodation and the title of the report in the subject line of e-mail. Competitive Foods and Beverages Available for Purchase in Secondary Schools --- Selected Sites, United States, 2004The percentage of overweight youths aged 12--19 years in the United States more than tripled from 5% during 1976--1980 to 16% during 1999--2002 (1). Overweight youths are at increased risk for cardiovascular consequences and other serious physical and psychosocial health problems (2). Because most youths are enrolled in school, the school nutrition environment is integral to any strategy to improve dietary behavior and reduce overweight among youths. In most schools, the nutrition environment has two components: the U.S. Department of Agriculture (USDA) school meals program and the sale of competitive foods. USDA defines competitive foods as those foods and beverages, regardless of nutritional value, sold at a school separate from the USDA school meals program (3). To identify the types of competitive foods and beverages available for purchase from school vending machines or at school stores, canteens, or snack bars, CDC analyzed data from the 2004 School Health Profiles for public secondary schools in 27 states and 11 large urban school districts. This report summarizes the results of that analysis, which indicated that, in 2004, the majority of secondary schools (median across states: 89.5%; median across large urban school districts: 81.5%) allowed students to purchase snack foods or beverages from vending machines or at the school store, canteen, or snack bar. In addition, the percentage of schools offering certain types of snack foods and beverages varied across states and large urban school districts. Although the majority of schools offered some nutritious foods and beverages in these settings, the majority of schools also offered less nutritious choices. Educators, families, and school and public health officials should work together to provide school nutrition environments that will help improve dietary behavior and reduce overweight among youths. School Health Profiles* is conducted biennially to assess characteristics of school health programs. State and local departments of education and health select either all public secondary schools within their jurisdictions or a systematic, equal-probability sample of public secondary schools to participate in School Health Profiles. At each school, the principal and lead health education teacher are sent questionnaires to be self-administered and returned to the state or local agency conducting the survey. Only principals (or their designees) were asked questions regarding competitive foods available for purchase by students in their schools. Participation in School Health Profiles is confidential and voluntary. Follow-up telephone calls and written reminders were used to encourage participation. Data from each survey were weighted to reflect the likelihood of principals being selected and to adjust for differing patterns of nonresponse. Results represent all public secondary schools in each jurisdiction. Principals were asked the following questions: 1) "Can students purchase snack foods or beverages from vending machines or at the school store, canteen, or snack bar?" 2) "Can students purchase each snack food or beverage (chocolate candy; other kinds of candy; salty snacks that are not low in fat; soft drinks, sports drinks, or fruit drinks that are not 100% juice; fruits or vegetables; salty snacks that are low in fat; low-fat cookies, crackers, cakes, or other low-fat baked goods; 100% fruit juice; or bottled water) from vending machines or at the school store, canteen, or snack bar?" and 3) "Can students purchase candy; high-fat snacks; or soft drinks, sports drinks, or fruit drinks that are not 100% juice during the following times (before classes begin in the morning, during any school hours when meals are not being served, and during school lunch periods)?" In 2004, a total of 27 states and 11 large urban school districts† obtained weighted data from their survey of principals. Among states, the number of principals participating ranged from 58 to 607 (median: 281), and response rates ranged from 70% to 93% (median: 80%). Among large urban school districts, the number of principals participating ranged from 16 to 262 (median: 50), and response rates ranged from 73% to 98% (median: 84%). The percentage of schools that allowed students to purchase snack foods or beverages from vending machines or at the school store, canteen, or snack bar ranged from 59.8% to 95.0% (median: 89.5%) across states and from 33.2% to 96.1% (median: 81.5%) across large urban school districts (Table). Among schools allowing purchases, the types of less nutritious foods and beverages available for purchase from the vending machine or at the school store, canteen, or snack bar varied. Chocolate candy was offered by 34.5% to 93.4% (median: 65.0%) of schools across states and by 27.3% to 82.4% (median: 58.0%) of schools across large urban school districts. Other kinds of candy were offered by 39.7% to 94.4% (median: 67.7%) of schools across states and by 33.7% to 82.5% (median: 62.3%) of schools across large urban school districts. Salty snacks not low in fat were offered by 53.5% to 89.4% (median: 74.5%) of schools across states and by 52.4% to 91.7% (median: 81.8%) of schools across large urban school districts. Soft drinks, sports drinks, or fruit drinks not 100% juice were offered by 78.9% to 99.5% (median: 95.4%) of schools across states and by 53.4% to 100.0% (median: 92.1%) of schools across large urban school districts. Schools also offered foods and beverages that are more nutritious. Fruits or vegetables were offered by 18.5% to 57.8% (median: 44.5%) of schools across states and by 14.7% to 77.1% (median: 45.9%) of schools across large urban school districts (Table). Salty snacks low in fat were offered by 55.6% to 92.5% (median: 79.6%) of schools across states and by 50.8% to 88.1% (median: 77.2%) of schools across large urban school districts. Low-fat baked goods were offered by 41.0% to 80.2% (median: 60.6%) of schools across states and by 28.5% to 75.0% (median: 65.2%) of schools across large urban school districts. One hundred percent fruit juice was offered by 56.6% to 95.5% (median: 84.2%) of schools across states and by 61.7% to 90.1% (median: 83.3%) of schools across large urban school districts. Bottled water was offered by 83.9% to 100% (median: 94.3%) of schools across states and by 79.6% to 100% (median: 95.6%) of schools across large urban school districts. Among schools that allowed students to purchase snack foods or beverages from vending machines or at the school store, canteen, or snack bar, the percentage of schools that allowed students to purchase candy; high-fat snacks; or soft drinks, sports drinks, or fruit drinks that are not 100% juice during school lunch periods ranged from 22.2% to 90.1% (median: 66.0%) across states and from 48.7% to 89.5% (median: 70.3%) across large urban school districts. From 34.8% to 82.8% (median: 60.3%) of schools across states and from 18.1% to 83.3% (median: 43.1%) of schools across large urban school districts allowed purchases before classes begin in the morning and from 20.8% to 62.0% (median: 44.7%) of schools across states and from 7.4% to 58.3% (median: 22.1%) of schools across large urban school districts allowed purchases during any school hours when meals were not being served. Reported by: L Kann, PhD, JA Grunbaum, EdD, ML McKenna, PhD, H Wechsler, EdD, Div of Adolescent and School Health; DA Galuska, PhD, Div of Nutrition and Physical Activity, National Center for Chronic Disease Prevention and Health Promotion, CDC. Editorial Note:The findings in this report indicate that the majority of secondary schools in 27 states and 11 large urban school districts allow students to purchase snack foods or beverages from vending machines or at the school store, canteen, or snack bar. The types of competitive foods and beverages available for purchase varies across states and large urban school districts. Overall, fruits or vegetables are less likely to be available for purchase than the other types of foods or beverages. Bottled water and soft drinks, sports drinks, or fruit drinks that are not 100% juice are most likely to be available for purchase. Multiple federal regulations govern the foods and beverages offered in the USDA school meals program. However, apart from that program, the only federal regulations regarding sale of foods and beverages in schools prohibit access to foods of minimal nutritional value (FMNV)§ (4) in food-service areas during meal times. Under federal regulations, foods such as potato chips, chocolate bars, and doughnuts are not considered FMNV and can be sold in the cafeteria or elsewhere at any time. At least 28 states and many school districts and schools have adopted more stringent regulations (5). For example, the Texas Public School Nutrition Policy (6) prohibits middle schools or junior high schools from serving or providing access to FMNV and all other forms of candy on school premises until after the end of the last lunch period and prohibits senior high schools from serving or providing access to FMNV during meal periods in areas where reimbursable meals are served or eaten. The policy also restricts portion sizes for foods and beverages sold apart from school meals on school campuses. In the Los Angeles Unified School District (7), only foods that meet specified nutrient standards are authorized for sale apart from the school meals program before, during, and until one-half hour after the end of the school day. The findings in this report are subject to at least three limitations. First, these data apply only to public secondary schools and therefore do not reflect practices at private schools. Second, these data were self-reported by school principals (or their designees) and were not verified by a second source. Finally, these data were collected during spring 2004 and do not reflect any state, district, or school policies enacted since then. To help improve dietary behavior and reduce overweight among youths, CDC recommends offering appealing and nutritious foods in school snack bars and vending machines and discouraging sale of foods high in fat, sodium, and added sugars on school grounds or as part of fund-raising activities (8). Science-based strategies are available to help states, districts, and schools act on these recommendations. For example, the School Health Index (9) helps schools identify the strengths and weaknesses of their health-promotion policies and programs and develop an action plan to ensure that students have access to appealing and nutritious foods and beverages outside the school meals program. In addition, Making It Happen! School Nutrition Success Stories (10) describes how 32 schools and school districts across the United States have improved the nutritional quality of foods and beverages offered apart from the school meals program. Acknowledgments This report is based on data collected by state and local School Health Profiles coordinators. References
* Available at http://www.cdc.gov/healthyyouth/profiles. † Secondary schools (i.e., middle, junior high, and senior high schools) serving students in grades 6--12 were surveyed in the following CDC-funded states and large urban school districts. States: Alaska, Arizona, Arkansas, Connecticut, Delaware, Idaho, Iowa, Maine, Massachusetts, Michigan, Minnesota, Missouri, Montana, Nebraska, New Hampshire, New York, North Carolina, North Dakota, Oklahoma, Oregon, Pennsylvania, South Carolina, Tennessee, Texas, Utah, Washington, and Wisconsin. School districts: Chicago, Illinois; Dallas, Texas; District of Columbia; Los Angeles, California; Memphis, Tennessee; Miami, Florida; New Orleans, Louisiana; Orange County, Florida; Philadelphia, Pennsylvania; San Bernardino, California; and San Diego, California. § Defined as items that provide less than 5% of the U.S. recommended daily allowance per serving for each of eight essential nutrients. FMNV include carbonated soft drinks, water ices, chewing gum, and certain candies that consist mostly of sweeteners (e.g., hard candies and jelly beans).
Table
Disclaimer All MMWR HTML versions of articles are electronic conversions from ASCII text into HTML. This conversion may have resulted in character translation or format errors in the HTML version. Users should not rely on this HTML document, but are referred to the electronic PDF version and/or the original MMWR paper copy for the official text, figures, and tables. An original paper copy of this issue can be obtained from the Superintendent of Documents, U.S. Government Printing Office (GPO), Washington, DC 20402-9371; telephone: (202) 512-1800. Contact GPO for current prices. **Questions or messages regarding errors in formatting should be addressed to mmwrq@cdc.gov.Date last reviewed: 9/22/2005 |
|||||||||
|