 |
|
|
|
|
|
|
| ||||||||||
|
|
|
|
|
|
|
||||
| ||||||||||
|
|
|
|
|
Persons using assistive technology might not be able to fully access information in this file. For assistance, please send e-mail to: mmwrq@cdc.gov. Type 508 Accommodation and the title of the report in the subject line of e-mail. Differences in Disability Among Black and White Stroke Survivors --- United States, 2000--2001Stroke is a leading cause of serious, long-term disability in the United States (1) and was responsible for an estimated $53.6 billion in direct and indirect costs during 2004 (2). Stroke survivors can experience residual physical, psychological, and social impairment (3); nearly 45% of all stroke survivors aged >65 years have moderate or severe disability (4). Furthermore, persons in certain racial/ethnic populations experience disparities in stroke-related disability (5). To assess the prevalence of functional limitations among U.S. adult stroke survivors and to examine potential racial/ethnic disparities in stroke-related disability, CDC analyzed National Health Interview Survey (NHIS) data from 2000--2001. The results of this analysis indicated that black stroke survivors had greater activity limitations than white stroke survivors. To increase the quality and length of life among stroke survivors and to eliminate disparities in stroke incidence, greater efforts are needed to implement stroke prevention and intervention activities among black populations, particularly young to middle-aged adults. Increasing public awareness of stroke-related warning signs and encouraging patients to seek immediate treatment might reduce stroke-related disabilities and costs. NHIS is a household survey designed and conducted annually by CDC to collect self-reported information from a representative sample of the U.S. civilian, noninstitutionalized population. Data collected in 2000 and 2001 were combined. Respondents who reported having ever been told by a doctor or other health professional that they had had a stroke were identified as stroke survivors. Stroke survivors were asked about their ability to perform the following 12 activities: 1) walk a quarter mile (i.e., approximately three city blocks); 2) walk up 10 steps without resting; 3) stand or be on feet for approximately 2 hours; 4) sit for approximately 2 hours; 5) stoop, bend, or kneel; 6) reach up over head; 7) use fingers to grasp or handle small objects; 8) lift or carry something as heavy as 10 pounds (e.g., a full bag of groceries); 9) push or pull large objects (e.g., living room chair); 10) go out (e.g., shopping, movies, or sporting events); 11) participate in social activities (e.g., visit friends, attend clubs or meetings, or go to parties; and 12) do things to relax at home or for leisure (e.g., read, watch TV, sew, or listen to music). Limitation of activity was defined as a reported response of either "very difficult" or "can't do at all" (compared with "not at all difficult," "only a little difficult," "somewhat difficult," or "do not do this activity"). The need for special equipment (e.g., cane, wheelchair, special bed, or special telephone) was also assessed. A total of 65,700 persons aged >18 years participated in the 2000 and 2001 NHIS surveys; 1,613 (2.2%) respondents reported ever having a stroke. Differences in sociodemographic characteristics and limitation of activities between non-Hispanic blacks and non-Hispanic whites with stroke were compared. The prevalence of stroke was 2.3% among whites and 2.7% among blacks; approximately 3.4 million non-Hispanic whites and 600,000 non-Hispanic blacks survived a stroke and lived at home during 2000--2001. Hispanics and persons of other races/ethnicities were excluded because of small sample size; the sample consisted of 1,391 noninstitutionalized stroke survivors, including 297 blacks and 1,094 whites. Statistical software was used for all analyses to account for complex multistage sampling design and to obtain estimates representative of the U.S. population. Compared with whites, blacks with stroke were significantly (p<0.05) more likely to be aged <65 years (blacks: 52.7%; whites: 34.8%), have less than a high school education (blacks: 47.5%; whites: 29.2%), live below the poverty level (blacks: 22.6%; whites: 8.9%), and report an annual income of less than $20,000 (blacks: 53.4%; whites: 33.3%); however, no statistically significant racial differences by sex or employment status were observed among stroke survivors (Table 1). Among stroke survivors, the most common limitations of activity were in standing or being on one's feet for approximately 2 hours (blacks: 50.2%; whites: 41.1%); pushing or pulling large objects (blacks: 45.2%; whites: 32.5%); walking a quarter mile (blacks: 45.1%; whites: 36.5); stooping, bending, or kneeling (blacks: 44.8%; whites: 37.7%); and walking up 10 steps without resting (blacks: 42.4%; whites: 28.6%)(Table 2). Blacks (49.6%) were significantly more likely (p<0.05) than whites (33.8%) to mention stroke as one of the health conditions causing limitations in activities. After adjustment for age and sex, blacks were significantly more likely (p<0.05) than white stroke survivors to report limitations in all of the 12 activities (Table 2). For example, blacks were 80% more likely to report walking up 10 steps without resting as "very difficult" or "can't do at all" compared with whites (adjusted odds ratio [AOR] = 1.79; 95% confidence interval [CI] = 1.59--2.01). In addition, after adjustment for education, blacks were significantly more likely (p<0.05) than whites to have limitations in seven of the 12 activities. In addition, 50.1% of blacks reported using special equipment (e.g., canes, wheelchairs, special beds, or special telephones), compared with 35.6% of whites (AOR = 1.55; 95% CI = 1.37--1.75). Reported by: HF McGruder, PhD, KJ Greenlund, PhD, JB Croft, PhD, ZJ Zheng, PhD, Div of Adult and Community Health, National Center for Chronic Disease Prevention and Health Promotion, CDC. Editorial Note:This study observed that more than half of non-Hispanic black stroke survivors living at home were aged <65 years compared with one third of non-Hispanic white stroke survivors. In addition, blacks were more likely than whites to report limitations in performing all of the activities considered in this study. Researchers have suggested that racial differences in disability status might be attributed to socioeconomic status and morbidity (5). Black adults aged >65 years had significantly higher levels of disability when compared with older whites, and stroke and other health conditions (e.g., heart trouble, diabetes, hip fracture, broken bones, and cancer) were associated with disability (5). In a British study, blacks characterized their health status and health transition (i.e., change from much better to much worse health) 3 months after stroke substantially lower than white stroke survivors (6). According to the study, blacks might have experienced more disability and a lower quality of life compared with whites after stroke because they were younger and had more severe and disabling strokes than whites (6). To meet national health objectives of increasing quality and years of healthy life and eliminating health disparities (7), greater efforts are needed to implement prevention and intervention activities for stroke among black populations, particularly among young to middle-aged adults. The findings in this report are subject to at least five limitations. First, reports of stroke and limitation of activity were obtained from self-reports and were not confirmed by medical records or neurologic examination. Second, NHIS does not collect information regarding the severity of the stroke or whether it was a first or recurrent stroke. Third, NHIS does not include institutionalized persons, including those living in nursing homes or other institutions. Fourth, the survey does not assess activity levels before the adverse health event. Although this report indicates stroke as the common health condition causing self-reported limitations in activities, the extent to which stroke limited participation in these activities is unclear. Finally, this report only examines functional disabilities and not disabilities associated with personal activities of daily living (e.g., bathing, dressing, using the toilet, and eating) and independent living activities (e.g., preparing meals, managing money, performing light housework, or using the telephone) that can provide a broader perspective concerning disabilities among stroke survivors. Future analyses should examine stroke-related limitations associated with a broader range of activities. National public health efforts to reduce stroke disability address both stroke prevention and treatment interventions (8). For example, the CDC Paul Coverdell National Acute Stroke Registry operates in Georgia, Illinois, Massachusetts, and North Carolina to track and improve delivery of care to hospital patients with acute stroke. Data from this registry will help state health departments and hospitals develop plans to reduce delay times in emergency transport, promote health-system adherence to clinical practice guidelines for stroke evaluation and treatment, improve the quality of life of stroke survivors, and reduce disability from stroke. In addition, CDC funds health departments in 32 states and the District of Columbia to develop, implement, and evaluate programs that promote cardiovascular health, increase public awareness, prevent disease, and eliminate health disparities. An example of eliminating health disparities is to collaborate on developing systems and intervention programs to detect and control high blood pressure among high-risk groups. CDC and its partners are implementing a plan (9) to address specific steps toward preventing heart disease and stroke through 2020 and beyond. Improvements in stroke survival and reduction of disability might be influenced by implementing culturally appropriate public education messages. These messages should increase awareness of stroke signs and symptoms and the need to promptly call 911 to reduce treatment delay (10). References
Table 1 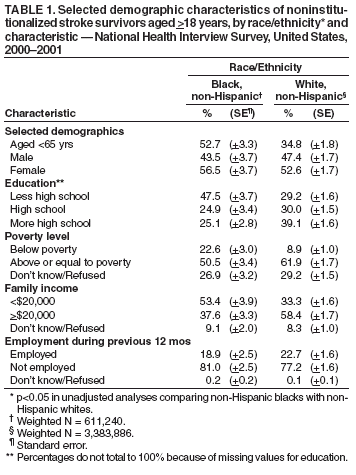 Return to top. Table 2 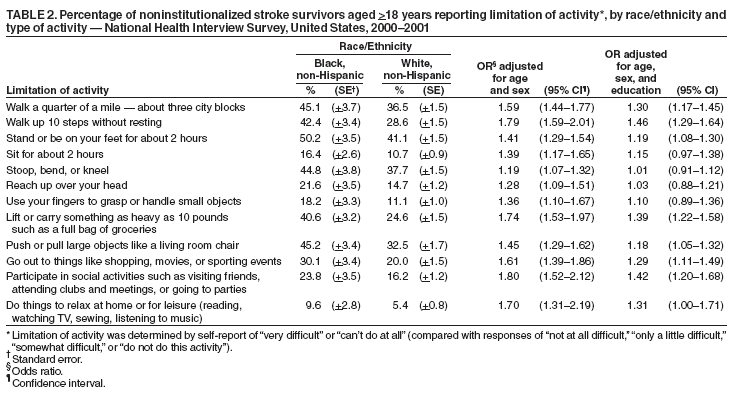 Return to top.
Disclaimer All MMWR HTML versions of articles are electronic conversions from ASCII text into HTML. This conversion may have resulted in character translation or format errors in the HTML version. Users should not rely on this HTML document, but are referred to the electronic PDF version and/or the original MMWR paper copy for the official text, figures, and tables. An original paper copy of this issue can be obtained from the Superintendent of Documents, U.S. Government Printing Office (GPO), Washington, DC 20402-9371; telephone: (202) 512-1800. Contact GPO for current prices. **Questions or messages regarding errors in formatting should be addressed to mmwrq@cdc.gov.Page converted: 1/13/2005 |
|||||||||
This page last reviewed 1/13/2005
|