 |
|
|
|
|
|
|
| ||||||||||
|
|
|
|
|
|
|
||||
| ||||||||||
|
|
|
|
|
Persons using assistive technology might not be able to fully access information in this file. For assistance, please send e-mail to: mmwrq@cdc.gov. Type 508 Accommodation and the title of the report in the subject line of e-mail. Influenza Vaccination and Self-Reported Reasons for Not Receiving Influenza Vaccination Among Medicare Beneficiaries Aged >65 years --- United States, 1991--2002Annual influenza vaccination of the U.S. elderly population has been demonstrated as safe and effective in reducing the risks of illness, hospitalization, and death (1). The Medicare Current Beneficiary Survey (MCBS) has measured annual influenza vaccination rates since 1991; the latest data available are for the 2001--02 influenza season. Since 1996, self-reported reasons for not receiving influenza vaccine also have been measured. During 1991--2002, MCBS indicated a steady upward trend in vaccination coverage among Medicare beneficiaries, with the exception of the 2000--01 influenza season, when vaccine distribution was delayed. The most frequently cited reasons for not receiving influenza vaccine were 1) not knowing that influenza vaccination was needed and 2) concerns that vaccination might cause influenza or side effects. During the 2000--01 influenza season, vaccine shortage or unavailability was noted for the first time as an important reason for nonvaccination. Further efforts are needed to educate the elderly regarding the benefits of influenza vaccination and to address any concerns regarding the safety of the vaccine. MCBS is a nationally representative survey of the Medicare population, conducted by the Centers for Medicare & Medicaid Services (CMS). Beneficiaries sampled from Medicare enrollment files (or appropriate proxies) are interviewed in person. Primary sampling units (PSUs) consist of persons in 107 geographic areas chosen to represent the nation; beneficiaries residing in these PSUs are selected by systematic random sampling within age strata. Data for this report were analyzed by using statistical software to account for sampling weights in calculating point estimates of proportions; analyses were restricted to Medicare beneficiaries aged >65 years who resided in a noninstitutional setting. Each year, MCBS asks respondents, "Did you have a flu shot for last winter?" The percentage reporting receipt of influenza vaccination increased each influenza season from 1991--92 through 1999--2000, and especially in 1993--94 (Figure 1), when influenza vaccination first became a Medicare benefit. However, during the 2000--01 influenza season, the vaccination rate declined instead of maintaining an annual increase; 67.0% (20.5 million of 30.6 million Medicare beneficiaries aged >65 years living in the community) reported receiving the vaccine, compared with a record high of 70.0% (21.2 million out of 30.3 million) in 1999--00. For the 2001--02 influenza season, 68.8% (21.3 million of 31.0 million) reported receiving influenza vaccine. The MCBS also asks about reasons for not getting influenza vaccination. The question asked is "Why didn't you get a flu shot for last winter?" Respondents are free to give any reason or reasons, with open-ended responses recorded by interviewers into prespecified categories. This question was omitted for the 1999--00 influenza season. The leading reasons for nonvaccination reported for 1997--98, 1998--99, 2000--01, and 2001--02 were not knowing that influenza vaccination was needed and concerns that vaccination might cause influenza or side effects (Figure 2). In 2000--01, for the first time, one of the leading reasons was that vaccine was unavailable or in short supply. For the 2000--01 season, 12.7% of unvaccinated respondents reported vaccine unavailability as a reason for not receiving influenza vaccine. This equates to approximately 1.25 million persons, or 4.2% of the total elderly Medicare population living in the community, which amounts to roughly the difference between the expected annual increase and the actual decline for 2000--01 in self-reported influenza vaccination. By contrast, during the 2001--02 influenza season, an estimated 7.5% of unvaccinated respondents (approximately 707,000 persons, or 2.3% of the total elderly Medicare population living in the community) reported vaccine unavailability as a reason for nonvaccination. Reported by: GS Adler, MPhil, Office of Research, Development, and Information, Centers for Medicare & Medicaid Svcs. CA Winston, PhD, Immunization Svcs Div, National Immunization Program, CDC. Editorial Note:For the 2000--01 influenza season, production delays created shortages of influenza vaccine, especially at the beginning of the vaccination period (i.e., October and November), when demand was greatest (2). Delays in vaccine production continued for the 2001--02 influenza season but were considered less severe (3). The 2000--01 decline and subsequent rebound of vaccination coverage in 2001--02 was observed by other government health surveys (4--6). However, the self-reported MCBS data establish an association between vaccine shortages and reduced vaccination rates among the Medicare population aged >65 years, one of the groups at high risk for influenza complications. The findings in this report are subject to at least two limitations. First, vaccination status during the preceding influenza season is self-reported and subject to recall and social desirability bias. Second, the results are subject to survivor bias (i.e., persons who died could not be interviewed about their vaccination status the previous winter). Finally, participant reasons for nonvaccination are categorized during the interview, rather than recorded verbatim. Although "other" reasons are captured as a category and reviewed for retrospective categorizing of responses, interviewer coding might result in misclassification or in a different distribution of reasons than would be obtained by providing respondents a list of answers from which to choose. Consequences from the vaccine shortage in 2000--01 were limited because of the mildness of the influenza virus that season (7). CDC has previously estimated that for each 1 million elderly persons vaccinated, approximately 900 deaths and 1,300 hospitalizations are prevented (8). Influenza vaccination rates are used as indicators of progress toward achieving the national health objectives for 2010. CMS, together with CDC, has conducted a long-term, structured campaign to promote the benefits of vaccination to Medicare beneficiaries and to improve provider performance. These efforts have resulted in large increases in vaccination during the preceding decade. However, even the strongest efforts of government agencies to promote vaccination are subject to the constraints of limited vaccine supply. During the current influenza vaccine shortage, vaccine is prioritized for populations at high risk, including the elderly. During 1997--2002, other reasons for nonvaccination were cited more often than reduced availability of vaccine. The most common reasons for nonvaccination were lack of knowledge about the need for vaccination and misconceptions about influenza vaccination and disease or side effects (9). These reasons remain important modifiers of elderly Medicare beneficiaries' behavior and can be further addressed through communications about influenza vaccination. Evidence-based strategies should be developed and used to 1) educate the public and vaccination providers regarding the benefit of influenza vaccine for the elderly and 2) address concerns about the safety and efficacy of the vaccine. References
Figure 1 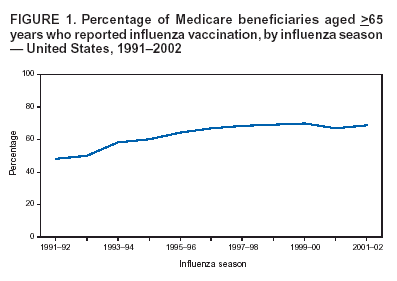 Return to top. Figure 2 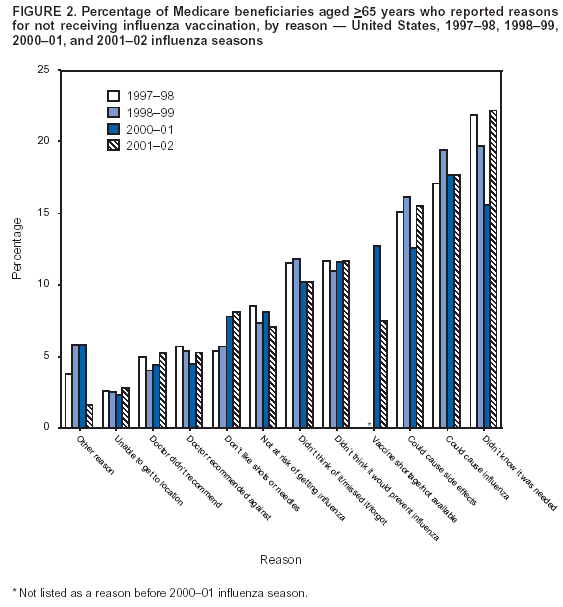 Return to top.
Disclaimer All MMWR HTML versions of articles are electronic conversions from ASCII text into HTML. This conversion may have resulted in character translation or format errors in the HTML version. Users should not rely on this HTML document, but are referred to the electronic PDF version and/or the original MMWR paper copy for the official text, figures, and tables. An original paper copy of this issue can be obtained from the Superintendent of Documents, U.S. Government Printing Office (GPO), Washington, DC 20402-9371; telephone: (202) 512-1800. Contact GPO for current prices. **Questions or messages regarding errors in formatting should be addressed to mmwrq@cdc.gov.Page converted: 11/4/2004 |
|||||||||
This page last reviewed 11/4/2004
|