 |
|
|
|
|
|
|
| ||||||||||
|
|
|
|
|
|
|
||||
| ||||||||||
|
|
|
|
|
Persons using assistive technology might not be able to fully access information in this file. For assistance, please send e-mail to: mmwrq@cdc.gov. Type 508 Accommodation and the title of the report in the subject line of e-mail. Effect of Revised Population Counts on County-Level Hispanic Teen Birthrates --- United States, 1999In 2002, teen birthrates for Hispanics were higher than for all other racial/ethnic populations (1). Because of the health and social risks associated with teen births, pregnancy prevention programs and accurate surveillance of teen birthrates are critical. To assess the effect of using revised population estimates for the 1990s (intercensal estimates) that take into account both the 1990 and 2000 U.S. Census counts (2,3), CDC analyzed county-level estimates of Hispanic teen birthrates for 1999. This report summarizes the results of that analysis, which indicated that Hispanic teen birthrates for 1999, when calculated on the basis of the 2000 census, were lower than birthrates based on the 1990 census for the majority of counties with substantial Hispanic populations. Population estimates for 1999 based on the 1990 census (postcensal estimates) had failed to capture the unprecedented and unanticipated migration of Hispanics, thereby overestimating the Hispanic teen birthrate. However, the increase in the Hispanic teen population and the corresponding decrease in Hispanic teen birthrates for 1999 were not experienced by all counties. This county-level variation provides essential information for programs targeting Hispanic teens at the county level. Estimates of Hispanic teen birthrates were calculated by using birth-certificate data (i.e., number of births to Hispanic females aged 15--19 years) and population counts (i.e., number of Hispanic females aged 15--19 years) from the U.S. Census Bureau. County-level Hispanic teen birthrates were calculated from CDC's National Center for Health Statistics birth data for 1999 and from two sets of denominators: 1) Hispanic population figures for 1999, as estimated from the 1990 census, and 2) intercensal estimates for the 1999 Hispanic population that take into account the results of both the 1990 and 2000 censuses. Standard summary measures (e.g., mean, median, and range) of the levels and changes in Hispanic teen birthrates were used; both medians and means are presented because medians are less influenced by extreme values than means. The mean percentage changes are averages of each county's percentage change in its Hispanic teen birthrate; the data used for these calculations are available on request. Public-use birth data for 1999 are provided only for counties with >100,000 total population according to the 1990 census (n = 458 counties). Counties with a population of <100,000 are not included because of confidentiality limitations. This analysis is limited further to counties with >20 Hispanic teen births in 1999 (n = 284) to increase statistical reliability. Comparison of Hispanic teen birthrates for 1999 based on the 284 counties with national estimates for the same year suggests minimal bias resulted from including only these counties in the analysis. The percentage change in the Hispanic teen birthrate for 1999 using the revised population estimates was -6.9% for the 284 counties, compared with -7.1% for the United States as a whole (Table 1) (4). The 1990 census-based rates for the 284 counties were similar to those for the United States as a whole; the same was true for rates derived from the 2000 census. Data from 1999 were used to illustrate the pronounced effect that changing denominators might have on birthrate calculations. Estimates for years later in the decade are more prone to the error introduced by the estimation procedure used to create the postcensal counts (4,5), which increases with each year. Hispanic origin and race are reported independently on birth certificates, but these data were not summarized further by race because the majority of births to Hispanic females were reported as white. The median county-level Hispanic teen birthrate for 1999 in the 284 counties included in the analysis was 100.8 per 1,000 females when based on 1990 postcensal estimates and 88.2 per 1,000 females when based on the intercensal estimates. The range of rates based on the 1990 census was 35.9--712.6; the range for those based on the intercensal estimates was 28.5--195.0. The mean Hispanic teen birthrate based on 1990 estimates was 121.4 per 1,000 females (standard error [SE] = 85.2); the mean birthrate based on intercensal estimates was 91.4 per 1,000 females (SE = 28.2). Thus, the mean change in 1999 county-level Hispanic teen births, as a result of population adjustment, was -30.1 (SE = 66.2), a mean percentage decline of 19% (SE = 0.16). The calculated Hispanic teen birthrate declined in 219 (77%) of the 284 counties as a result of the population-estimate adjustment; the Hispanic female population aged 15--19 years in those counties had been underestimated previously. In 53 counties, the estimated birthrate decreased by >30%. For example, in one county, where 416 births were recorded among Hispanic females aged 15--19 years, the Hispanic female population aged 15--19 years was estimated to be 2,674 on the basis of the 1990 postcensal estimate but was revised to 3,401 after the 2000 census. As a result, the estimated teen birthrate changed from 155.6 per 1,000 population to 122.3, a decrease of 21%. In 65 of the 284 counties, the teen birthrate calculation increased as a result of the population revision. In those counties, the size of the Hispanic female population aged 15--19 years based on the 1990 postcensal estimates had been overestimated. The average percentage change in the Hispanic teen birthrate (+9.3 %; SE = 9.4) was smaller than the percentage change observed for counties where the birthrate decreased as a result of the adjustment (-21.9 %; SE = 15.9). In 22 counties, the Hispanic teen birthrate increased by >10% as a result of the revision. Of the 284 counties included in the analysis, 126 were from traditional immigrant-receiving states with the largest Hispanic populations (California, Illinois, New Jersey, New York, and Texas) (Table 2) (6). Some of the greatest average percentage declines in county-level birthrates occurred in states where the Hispanic population increased most rapidly during the 1990s (Alabama, Arkansas, Delaware, Indiana, Kentucky, Minnesota, North Carolina, Rhode Island, and Tennessee) (6). Reported by: J Santelli, MD, Div of Reproductive Health, National Center for Chronic Disease Prevention and Health Promotion; BE Hamilton, PhD, SJ Ventura, MA, Div of Vital Statistics, National Center for Health Statistics; M Carter, PhD, EIS Officer, CDC. Editorial Note:The U.S. Census Bureau uses various data on factors of population change (e.g., births, deaths, and both domestic and international migration) to produce postcensal population estimates for the nation and for smaller administrative areas (e.g., counties). The estimation methods used are rigorous, but the data needed are not always available in the required detail. Data availability is always more tenuous in smaller administrative areas, where even relatively minor changes in population can have substantial effects on rates. Moreover, the errors become compounded with the passage of time. Thus, despite best efforts, official population estimates can deviate substantially from the true population count. During the 1990s, the size and distribution of the Hispanic teen population changed in unexpected ways. Data were not available to track the substantial migration of Hispanics during the 1990s and the settlement of Hispanics in new areas. These factors and better coverage of this population in the 2000 census compared with the 1990 census probably contributed to the differences between the postcensal and intercensal estimates for the 1999 Hispanic teen female population. Birthrates for Hispanics in other age groups and for other racial/ethnic populations also changed substantially as a result of the revised population estimates. Previously published reports have discussed adjusted national and state birthrates for subpopulations for the 1990s and early 2000s (4,5,7). The findings in this report are subject to at least two limitations. First, medians are less influenced by extreme values than means, but both measures might overstate the degree of change observed for most counties. Second, analysis was limited to counties with a population of >100,000 and with >20 Hispanic teen births. Therefore, the analysis is descriptive of larger counties and those with larger Hispanic populations. However, in such counties, estimates of birthrates and birthrate changes are more stable and reliable than those in smaller counties, where random variations in the number of births and size of the population can yield substantial yet insignificant differences in birthrates from year to year. Users of birthrate and other population-based data need to understand the reasons for, and potential effects of, population-estimate revisions and should interpret such data with caution, particularly because 2000 postcensal estimates become less certain with each year until the 2010 census. Although Hispanic teen birthrates in most counties examined here were adjusted downward as a result of the population revisions, the adjusted rates are still high compared with other populations. Hispanic teen pregnancy continues to merit a concerted public health response, which is already under way in multiple states and localities (8). References
Table 1 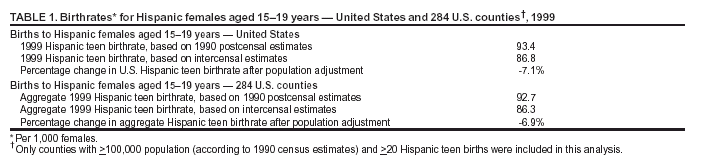 Return to top. Table 2 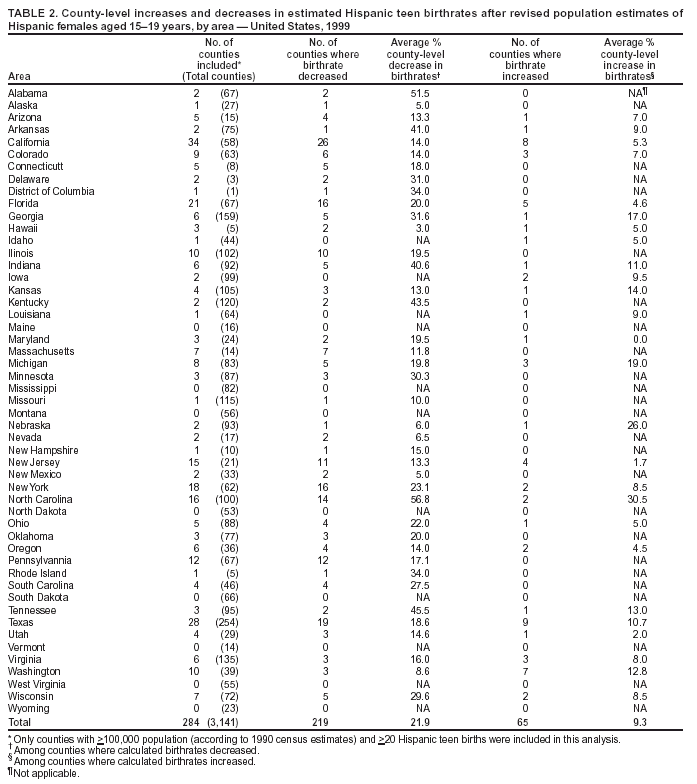 Return to top.
Disclaimer All MMWR HTML versions of articles are electronic conversions from ASCII text into HTML. This conversion may have resulted in character translation or format errors in the HTML version. Users should not rely on this HTML document, but are referred to the electronic PDF version and/or the original MMWR paper copy for the official text, figures, and tables. An original paper copy of this issue can be obtained from the Superintendent of Documents, U.S. Government Printing Office (GPO), Washington, DC 20402-9371; telephone: (202) 512-1800. Contact GPO for current prices. **Questions or messages regarding errors in formatting should be addressed to mmwrq@cdc.gov.Page converted: 10/14/2004 |
|||||||||
This page last reviewed 10/14/2004
|