 |
|
|
|
|
|
|
| ||||||||||
|
|
|
|
|
|
|
||||
| ||||||||||
|
|
|
|
|
Persons using assistive technology might not be able to fully access information in this file. For assistance, please send e-mail to: mmwrq@cdc.gov. Type 508 Accommodation and the title of the report in the subject line of e-mail. Physical Activity Among Asians and Native Hawaiian or Other Pacific Islanders --- 50 States and the District of Columbia, 2001--2003Data on physical activity participation rates among Asians and Native Hawaiian or Other Pacific Islanders (NHOPIs) in the United States are limited. For example, few studies have measured physical activity prevalence among the diverse Asian population, which was estimated to be 11.9 million in 2000 according to the U.S. Census and is projected to increase to 33.4 million by 2050 (1). One of the broadly defined goals of the 2010 national health objectives is to reduce disparities in health among population groups (2). To determine the prevalence of recommended levels of lifestyle (i.e., nonoccupational) physical activity (e.g., combined leisure-time, household-related, and transport-related), the prevalence of physical inactivity, and the prevalence of leisure-time physical inactivity among Asians and NHOPIs in the United States, CDC analyzed physical activity data from the Behavioral Risk Factor Surveillance System (BRFSS) surveys from 2001, 2002, and 2003 for the Asian and NHOPI populations from all 50 states and the District of Columbia (DC). This report summarizes the results of that analysis, which indicated that 38.6% of Asians and NHOPIs met recommended levels of lifestyle physical activity, compared with 45.8% of the total U.S. population, and approximately 24% were inactive during their leisure time. To increase physical activity in the Asian and NHOPI populations, state and local health departments and other organizations should adopt evidence-based strategies at the community and individual level to promote and encourage physical activity. BRFSS conducts annual random-digit--dialed state-based telephone surveys of the noninstitutionalized, U.S. civilian population aged >18 years. In 2001 and 2003, data for lifestyle physical activity and physical inactivity were collected in all states and DC. Data about leisure-time physical inactivity were collected in all 3 years (2001, 2002, and 2003). Annual sample sizes in BRFSS increased from 214,500 in 2001 to 264,684 in 2003. For this analysis, Asians and NHOPIs were defined as those respondents who did not report being of Hispanic origin and either self-selected their racial/ethnic identity as Asian or NHOPI or selected the multiracial category and identified one race/ethnicity as Asian or NHOPI. Three variables were used to describe activity levels: lifestyle physical activity, lifestyle physical inactivity, and no leisure-time physical activity. Lifestyle physical activity was assessed on the basis of participants' responses about their participation in nonoccupational physical activities of moderate intensity (e.g., brisk walking, bicycling, vacuuming, gardening, or anything else that causes small increases in breathing or heart rate) and vigorous intensity (e.g., running, aerobics, heavy yard work, or anything else that causes large increases in breathing or heart rate) for >10 minutes at a time in a usual week. Engaging in the recommended level of lifestyle physical activity was defined operationally as engaging in moderate-intensity physical activity >5 days per week for >30 minutes per day or in vigorous-intensity physical activity >3 days per week for >20 minutes per day or both. Respondents who reported no moderate or vigorous physical activity in a usual week were classified as inactive (lifestyle inactivity). Data for 2001 and 2003 were pooled to increase the sample size of Asians and NHOPIs. The sample size for NHOPIs was too small to allow for a separate analysis. Respondents were classified as having engaged in no leisure-time physical activity if they answered "no" to the survey question, "During the past month, other than your regular job, did you participate in any physical activities or exercise such as running, calisthenics, golf, gardening, or walking for exercise?" The time frame of this survey question was the "past 30 days" in 2001 and "past month" in 2002 and 2003. The response rates were 51.1% in 2001, 59.5% in 2002, and 54.0% in 2003 (3). SUDAAN was used to account for the complex sampling design. The overall sample consisted of 5,186 Asian and NHOPI respondents in 2001, 6,567 in 2002, and 5,848 in 2003. Physical activity was reported for body mass index (BMI) categories by using two guidelines. Participants' self-reported height and weight were used to calculate their BMI (weight in kg divided by height in m2). Participants were then categorized as underweight, normal weight, overweight, or obese. The first guideline used was the World Health Organization (WHO) standard: underweight (BMI <18.5), normal weight (BMI = 18.5--24.9), overweight (BMI = 25.0--29.9), and obese (BMI >30.0) (4). The second was the WHO Asia-Pacific guideline for Asian adults: underweight (BMI <18.5), normal weight (BMI = 18.5--22.9), overweight (BMI = 23.0--24.9), and obese (BMI >25.0) (5). Approximately 41.0% of Asian and NHOPI men and 35.8% of Asian and NHOPI women reported lifestyle physical activity participation that met or exceeded recommended levels of physical activity (Figure). These values were lower than overall estimates for U.S. men and women in 2003 (48.4 for men and 43.3 for women). In addition to having a lower prevalence of recommended levels of lifestyle physical activity, Asian and NHOPI women also had a higher prevalence of lifestyle physical inactivity (17.8%) than Asian and NHOPI men (14.9%). The prevalence of lifestyle inactivity among Asian and NHOPI men and women was nearly equal to estimates of the overall U.S. population (14.3% and 16.9%, respectively). Analyses by age indicated that the percentage of persons meeting recommended lifestyle physical activity levels was highest among men aged 18--34 years (46.6%) and women aged 50--64 years (37.7%) and lowest among men aged 50--64 years (33.4%) and women aged >65 years (31.7%) (Table). The percentage of respondents meeting recommended levels of lifestyle physical activity was higher among those who reported their health to be good, very good, or excellent (39.7%) than among those who reported it to be fair or poor (27.6%). Based on the standard WHO definitions for BMI classification, the prevalence of recommended lifestyle physical activity was slightly higher among respondents who were classified as obese (42.7%), compared with those who were classified as overweight (38.6%). Based on the WHO guidelines for Asian adults, the prevalence of recommended lifestyle physical activity was approximately 40.0% among normal weight, overweight, and obese respondents. The prevalence of lifestyle inactivity was highest among participants aged >65 years (24.3% among men and 27.9% among women) and was higher among those who had a high school education or less (24.7%) than among those who attended some college (13.8%). The prevalence of no leisure-time activity was lower among those who reported being in good, very good, or excellent health (22.8%) than among those who reported fair or poor health (34.0%). Reported by: J Kruger, PhD, SA Ham, MS, HW Kohl III, PhD, Div of Nutrition and Physical Activity, National Center for Chronic Disease Prevention and Health Promotion; S Sapkota, MBBS, EIS Officer, CDC. Editorial Note:The findings in this report indicate that, for 2001 and 2003 combined, approximately 39.0% of U.S. adults who self-identified as being of Asian and NHOPI ethnicity met the recommended levels of lifestyle physical activity, a substantially lower rate than that for the overall 2001 U.S. population (45.4%) (6). Although this report does not address disparities in physical activity among racial/ethnic populations directly, this observation supports summary findings from Healthy People 2010, which indicate a slightly lower percentage of Asians and NHOPIs (15.0%) engaged in recommended levels of moderate-intensity physical activity, compared with non-Hispanic whites (16.0%). Moreover, 17.0% of Asians and NHOPIs engaged in recommended levels of vigorous physical activity, compared with 25.0% of non-Hispanic whites (7). The estimated prevalence of no leisure-time physical activity among Asians and NHOPIs (23.9%) is similar to estimates documented in 2002 in 35 states and DC (25.1%) (8). To increase the proportion of Asians and NHOPIs who engage in the recommended amount of lifestyle physical activity, researchers will need to devise and implement effective intervention strategies to overcome barriers to physical activity specific to this population. Although socioeconomic factors have been associated with physical inactivity (9), the potential impact that cultural influences have on that association is not well understood. Results from this report conflict with evidence from other studies that suggests physical activity is associated with education among U.S. adults (2). The results from this study instead suggest that a higher percentage of Asians and NHOPIs with less formal education were more likely to participate in physical activity at least at the recommended level than those with more formal education. However, similar to the overall U.S. population (8), Asians and NHOPIs with more education reported lower levels of inactivity and no leisure-time physical activity than those with less education. Those who reported their health to be good, very good, or excellent were more likely to report meeting recommended levels of physical activity and less likely to report inactivity than participants who reported fair or poor health status. This report characterizes physical activity patterns among Asians and NHOPIs by using both the standard WHO guidelines and WHO Asia-Pacific guidelines to define overweight and obesity. The Asia-Pacific guidelines were created because of variations in body size and composition characteristics between Asian populations and those of largely European origin (5). On the basis of either set of guidelines, the results from this report suggest little difference in activity levels among those Asians and NHOPIs who were normal weight, overweight, or obese. For both sets of guidelines, the data suggest the percentage of participants who reported engaging in at least recommended levels of lifestyle physical activity was lowest among those classified as underweight. This finding is difficult to explain, especially given the heterogeneity among the Asian and NHOPI populations, and might be related to poor health. However, overweight and obese respondents might have reported meeting physical activity recommendations because physical activity was part of their weight-loss strategy or because they were responding to survey questions in what they deemed to be a socially desirable manner. The findings in this report are subject to at least four limitations. First, BRFSS data are based on telephone interviews and thus are subject to recall bias. Second, "Asian" does not describe a homogenous population but rather is an umbrella term for numerous distinct subpopulations such as Chinese, Asian Indians, and Vietnamese. For this report, NHOPI were grouped with Asians because of a small sample size; however, NHOPI are a separate racial group from Asians. Third, the limited number of Asian and NHOPI respondents in the BRFSS surveys required pooling of data across 2 or 3 years; however, slight differences in physical activity participation levels existed between 2001 and 2003. Finally, because BRFSS data are derived from telephone interviews, the survey sample might not have been representative of all Asians and NHOPIs, and the data might be limited by nonresponse and telephone coverage--related errors. Because approximately 61% of Asians and NHOPIs are not active at levels consistent with public health recommendations, local and state health departments and other interested groups are encouraged to establish prevention and public health education programs geared to this population. The Task Force on Community Preventive Services recommends six strategies to increase physical activity: 1) communitywide campaigns, 2) placement of signs near elevators and escalators to encourage stair usage, 3) individually adapted programs to promote health-behavior change, 4) physical education in schools, 5) social support interventions in community settings, and 6) creation or enhancement of access to places for physical activity in community environments in combination with informal outreach activities (10). These strategies could be tailored to Asian and NHOPI populations in several ways. For example, social support interventions targeting subpopulations could be used to design and promote culturally appropriate physical activities popular among this population. More research leading to effective intervention strategies for this population and additional health-promotion efforts to encourage increased physical activity among Asians and NHOPIs are needed. References
Table 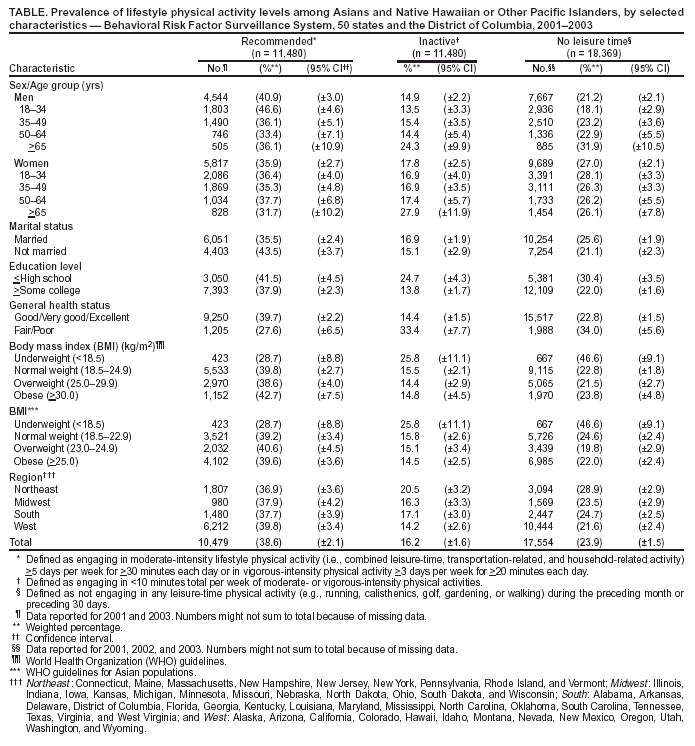 Return to top. Figure 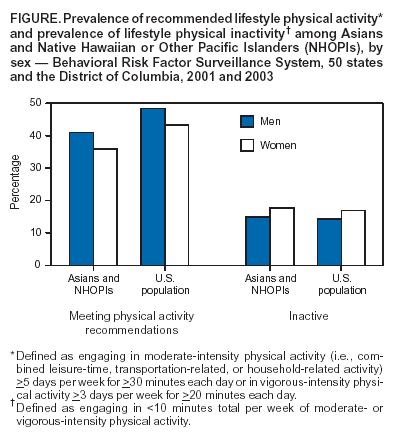 Return to top.
Disclaimer All MMWR HTML versions of articles are electronic conversions from ASCII text into HTML. This conversion may have resulted in character translation or format errors in the HTML version. Users should not rely on this HTML document, but are referred to the electronic PDF version and/or the original MMWR paper copy for the official text, figures, and tables. An original paper copy of this issue can be obtained from the Superintendent of Documents, U.S. Government Printing Office (GPO), Washington, DC 20402-9371; telephone: (202) 512-1800. Contact GPO for current prices. **Questions or messages regarding errors in formatting should be addressed to mmwrq@cdc.gov.Page converted: 8/26/2004 |
|||||||||
This page last reviewed 8/26/2004
|