|
|
|
|
|
|
|
| ||||||||||
|
|
|
|
|
|
|
||||
| ||||||||||
|
|
|
|
|
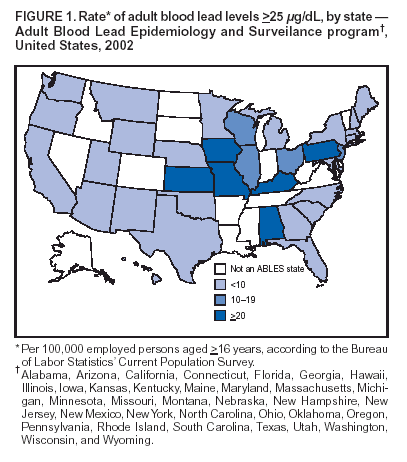
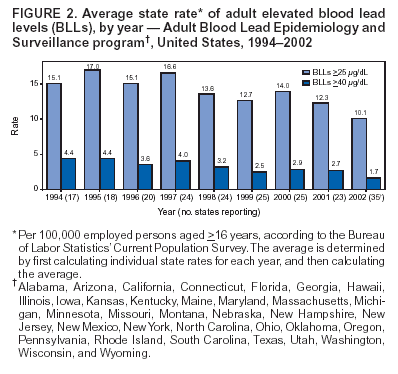
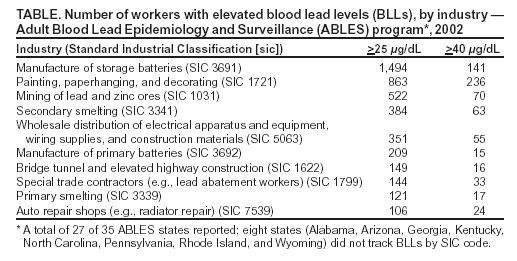
Persons using assistive technology might not be able to fully access information in this file. For assistance, please send e-mail to: mmwrq@cdc.gov. Type 508 Accommodation and the title of the report in the subject line of e-mail. Adult Blood Lead Epidemiology and Surveillance --- United States, 2002CDC's state-based Adult Blood Lead Epidemiology and Surveillance (ABLES) program tracks laboratory-reported blood lead levels (BLLs) in adults. A national health objective for 2010 is to reduce to zero the number of adults with BLLs >25 µg/dL (objective no. 20-07) (1). A second key ABLES measurement is BLLs >40 µg/dL, the level under which the Occupational Safety and Health Administration allows workers to return to work after being removed with an elevated BLL, and the level under which an annual medical evaluation of health effects related to lead exposure is required (2,3). The most recent ABLES report provided data collected during 1994--2001 (4). This report presents ABLES data for 2002, the first year that individual rather than summary data were collected. The 2002 data indicate that approximately 95% of adult lead exposures were occupational, 94% of those exposed were male, and 91% were aged 25--64 years. The findings also indicated that the national decline in the number of adults with elevated BLLs continued in 2002; however, even greater prevention activities, particularly in work environments, will be necessary to achieve the 2010 health objective. Nationwide Magnitude and TrendDuring 2002, a total of 10,658 adults from 35 states were reported with BLLs >25 µg/dL (Figure 1). During 2001, a total of 9,943 adults from 23 states were reported with BLLs >25 µg/dL (4). To compare yearly totals, the numbers of adults with elevated BLLs from each state were divided by the state's annual employed population aged >16 years to determine an annual state rate (5). The mean of the state rates in each year was then calculated to derive the average state rate. The average state rate for 2002 was 10.1 per 100,000 employed population, representing an 18% decrease from 2001 (12.3 per 100,000 employed population) (Figure 2) (4). Of the 10,658 adults with BLLs >25 µg/dL in 2002, a total of 1.7 per 100,000 employed population (1,854) were reported with BLLs >40 µg/dL, a 37% decrease compared with the 2.7 per 100,000 employed population (2,009) that were reported in 2001* (4). Occupational Sources of ExposureIn 2002, ABLES began to collect individual data rather than summary data. These individual data for adults with BLLs >25 µg/dL included Standard Industrial Classification (SIC) codes for the industries in which they worked and information regarding nonoccupational exposures. Twenty-seven of the 35 ABLES states provided SIC codes for 6,540 adults. These 27 states reported an additional 1,257 adults for whom SIC codes were unknown or unavailable. By industrial sector, among the 6,540 adults, 58% (3,771) were exposed in the manufacturing industry; 22% (1,458) in the construction industry; 8% (524) in mining; 7% (450) in the wholesale and retail trades; 3% (209) in the service industry; and 2% (128) in transportation and public utilities; finance, insurance, and real estate; or public administration. A further breakdown of occupational exposure is provided by using the 10 SIC codes with the most exposed workers (Table). Nonoccupational Sources of ExposureThe same 27 states that provided SIC codes also provided exposure sources for 338 adults whose lead exposures were determined to be nonoccupational. This group represented 5% of the 6,878 (6,540 occupational plus 338 nonoccupational) adults with BLLs >25 µg/dL. By state, percentages of nonoccupational exposures ranged from >15% in Connecticut, Maine, Maryland, Michigan, and Utah to <1% in Hawaii, Iowa, Montana, Nebraska, and Wisconsin. Among the 338 persons exposed to nonoccupational sources, 23% (78) were exposed from shooting firearms, 19% (65) from remodeling or renovation activities, 13% (45) from hobbies (e.g., casting, ceramics, and stained glass), 11% (36) from retained bullets or gunshot wounds, 7% (26) from pica, and 4% (13) from ingesting lead-contaminated food or liquids or nontraditional medicines. Distribution by StateFor adults with BLLs >25 µg/dL, with the exception of Alabama, states reporting prevalence rates of >10 per 100,000 employed population are clustered in the Midwest and lower Northeast (Figure 1). Rates ranged from a high of 46.9 per 100,000 employed population for Kansas to 0.8 for Arizona. Eighteen of the 23 states that reported BLLs in both 2001 and 2002 reported lower rates in 2002. The annual state rates of adults with BLLs >40 µg/dL ranged from a high of 7.4 per 100,000 employed population for Alabama to no reported cases for Montana and Wyoming. Eighteen of the 23 states that reported in both 2001 and 2002 reported lower rates in 2002 for adults with BLLs >40 µg/dL. Reported by: RJ Roscoe, MS, JR Graydon, Div of Surveillance, Hazard Evaluations, and Field Studies, National Institute for Occupational Safety and Health, CDC. Editorial Note:ABLES data for 2002 indicated that the nationwide rates of elevated BLLs in adults decreased, continuing their decline since 1994 (Figure 2). The decrease in rates could have resulted from improved prevention measures and also changes in employment patterns (e.g., decline in manufacturing jobs). The 2002 ABLES data provide nationwide information on individual adults for the first time; these data are expected to become more complete as reporting states become more experienced with the new individual reporting requirements. The findings in this report are subject to at least two limitations. First, inconsistencies exist in the numerators used to calculate the rates. The number of adults with elevated BLLs reported by ABLES states is underreported because 1) not all employers provide BLL testing to all lead-exposed workers and 2) certain laboratories might not report all tests. In addition, these factors can vary among the 35 ABLES states. Second, using the employed population as denominator has the advantage of excluding unemployed adults, most of whom have little or no risk for lead exposure. However, because the distribution of jobs that include lead exposure varies among the ABLES states, caution should be exercised in comparing rates among states. Additional information regarding interpretation of specific state ABLES data is available at http://www.cdc.gov/niosh/ables.html. Despite improvements in control of lead exposures, this hazard remains an occupational health problem in the United States. CDC's ABLES program continues to enhance surveillance for this preventable condition by increasing the number of participating states and by identifying the sources of persistent overexposures, helping states focus their intervention, education, and prevention activities. Acknowledgments This report is based in part on the contributions of ABLES coordinators in Alabama, Arizona, California, Connecticut, Florida, Georgia, Hawaii, Illinois, Iowa, Kansas, Kentucky, Maine, Maryland, Massachusetts, Michigan, Minnesota, Missouri, Montana, Nebraska, New Hampshire, New Jersey, New Mexico, New York, North Carolina, Ohio, Oklahoma, Oregon, Pennsylvania, Rhode Island, South Carolina, Texas, Utah, Washington, Wisconsin, and Wyoming. References
* Rates differ slightly from those previously published (4) because the employed populations have been updated by the Bureau of Labor Statistics' Current Population Survey (5).
Disclaimer All MMWR HTML versions of articles are electronic conversions from ASCII text into HTML. This conversion may have resulted in character translation or format errors in the HTML version. Users should not rely on this HTML document, but are referred to the electronic PDF version and/or the original MMWR paper copy for the official text, figures, and tables. An original paper copy of this issue can be obtained from the Superintendent of Documents, U.S. Government Printing Office (GPO), Washington, DC 20402-9371; telephone: (202) 512-1800. Contact GPO for current prices. **Questions or messages regarding errors in formatting should be addressed to mmwrq@cdc.gov.Page converted: 7/7/2004 |
|||||||||
This page last reviewed 7/7/2004
|