|
|
|
|
|
|
|
| ||||||||||
|
|
|
|
|
|
|
||||
| ||||||||||
|
|
|
|
|
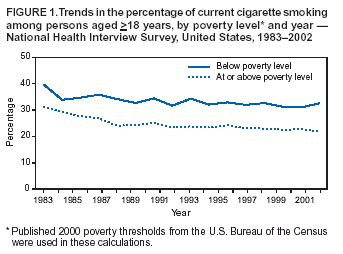
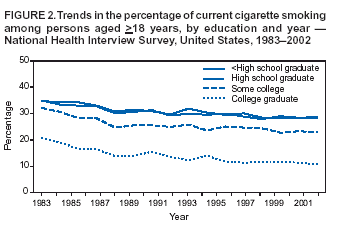
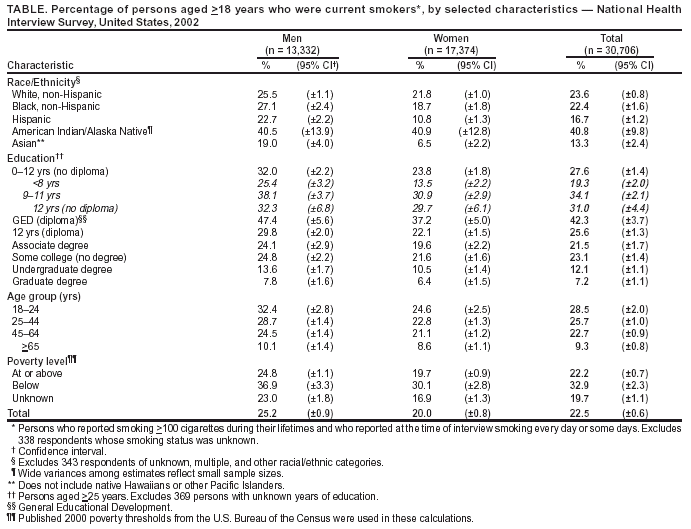
Persons using assistive technology might not be able to fully access information in this file. For assistance, please send e-mail to: mmwrq@cdc.gov. Type 508 Accommodation and the title of the report in the subject line of e-mail. Cigarette Smoking Among Adults --- United States, 2002One of the national health objectives for 2010 is to reduce the prevalence of cigarette smoking among adults to <12% (objective 27.1a) (1). To assess progress toward this objective, CDC analyzed self-reported data from the 2002 National Health Interview Survey (NHIS) sample adult core questionnaire. This report summarizes the results of that analysis, which indicated that, in 2002, approximately 22.5% of adults were current smokers. Although this prevalence is slightly lower than the 22.8% prevalence among U.S. adults in 2001 and substantially lower than the 24.1% prevalence in 1998, the rate of decline has not been at a sufficient pace to achieve the 2010 national health objective. During 1983--2002, adults with household incomes below the poverty level and those with less than some college education consistently had higher smoking prevalence. A comprehensive approach to smoking cessation that comprises educational, economic, clinical, and regulatory strategies and emphasizes reducing disparities is required to reduce further the prevalence of smoking (2). The 2002 NHIS adult core questionnaire was administered by personal interview to a nationally representative sample (n = 31,044) of the U.S. civilian, noninstitutionalized population aged >18 years; the overall survey response rate was 74.3%. Respondents were asked, "Have you smoked at least 100 cigarettes in your entire life?" and "Do you now smoke cigarettes every day, some days, or not at all?" Ever smokers were defined as those who reported having smoked >100 cigarettes during their lifetimes. Current smokers were defined as those who reported both having smoked >100 cigarettes during their lifetimes and currently smoking every day or some days. Former smokers were defined as ever smokers who currently did not smoke. Data were adjusted for nonresponses and weighted to provide national estimates of cigarette smoking prevalence. Confidence intervals (CIs) were calculated by using SUDAAN to account for the multistage probability sample. In 2002, an estimated 45.8 million adults (22.5%; 95% CI = ±0.6) were current smokers; of these, an estimated 37.5 million (81.8%) smoked every day, and 8.3 million (18.2%) smoked some days. Among those who smoked every day, an estimated 15.4 million (41.2%; 95% CI = ±1.5) reported that they had stopped smoking for >1 day during the preceding 12 months because they were trying to quit. In 2002, an estimated 46.0 million adults were former smokers, representing 50.1% (95% CI = ±1.1) of adults who had ever smoked; 2002 was the first year that more than half of ever smokers were former smokers. Cigarette smoking prevalence rates varied substantially across population subgroups (Table). The prevalence of smoking was higher among men (25.2%) than women (20.0%) and inversely related to age, from 28.5% for those aged 18--24 years to 9.3% for those aged >65 years. Among racial/ethnic groups, Asians (13.3%) and Hispanics (16.7%) had the lowest prevalence, and American Indians/Alaska Natives had the highest (40.8%). Current smoking prevalence also was higher among adults living below the poverty level* (32.9%) than among those at or above the poverty level (22.2%). During 1983--2002, the gap in smoking prevalence between those living below the poverty line and those living at or above it increased from 8.7 percentage points to 10.7 percentage points (Figure 1). In addition, the percentage of ever smokers who had quit was higher for persons at or above the poverty level than for those below the poverty line. As with current smoking prevalence, this gap was larger in 2002 than in 1983 (20.0 percentage points versus 18.7 percentage points). Educational attainment has been associated consistently with adult smoking prevalence since 1983 (Figure 2). By education level, smoking prevalence was highest among adults who had earned a General Educational Development diploma (42.3%) and lowest among those with graduate degrees (7.2%). Women with undergraduate (10.5%) or graduate degrees (6.4%) and men with graduate degrees (7.8%) also had smoking prevalence rates below the overall U.S. 2010 objective. During 1983--2002, the largest decreases in smoking prevalence occurred among adults with a college degree (10.0 percentage points) and those with some college education (9.3 percentage points); those with a high school diploma (6.6 percentage points) and those with less than a high school education (5.8 percentage points) showed the smallest decreases. During this period, the gap in smoking prevalence between adults who had graduated from college and those with less than a high school education increased from 14.0 percentage points in 1983 to 18.2 percentage points in 2002 (Figure 2). Similar patterns occurred in the percentage of ever smokers who had quit among different educational groups. The percentage of ever smokers who had quit was highest for those with college degrees, followed by persons with some college education. High school graduates and those with less than high school education had the lowest percentage of ever smokers who had quit. The gap between adults with a college degree and those with less than a high school education increased from 19.0 percentage points in 1983 to 25.9 percentage points in 2002. Reported by: C Husten, MD, K Jackson, MSPH, Office on Smoking and Health, National Center for Chronic Disease Prevention and Health Promotion; C Lee, PhD, EIS Officer, CDC. Editorial Note:The findings in this report indicate that 1) the socioeconomic status of U.S. adults is inversely related to their likelihood of smoking and 2) during 1983--2002, the gap in smoking prevalence by socioeconomic status did not narrow and might have widened. These findings underscore the need for targeted interventions that can better reach persons of lower socioeconomic status. Persons of low socioeconomic status have less access to health care than those of high socioeconomic status (3). Specific efforts to reduce socioeconomic disparities in smoking prevalence could include 1) offering comprehensive smoking cessation assistance through Medicaid and Medicare; 2) offer-ing smoking cessation advice and counseling through clinics that care for the uninsured; 3) increasing support for smoking cessation at work places, particularly for low-income and blue-collar workers; 4) implementing telephone quitlines in all states; and 5) employing more media-based cessation campaigns (2,4,5). Expanding the scope of cessation coverage through Medicaid, Medicare, and private insurance and ensuring that persons without health insurance can obtain medical assistance to quit smoking is a key strategy to help low-income smokers quit (4). The lower rates of quitting among blue-collar workers can be partially explained by the lack of social support for quitting in their work environments (5). Encouraging all employers to implement programs and policies supporting smoking cessation can help reduce consistently observed disparities in smoking prevalence between blue- and white-collar workers (6). In addition, because tobacco use prevalence is associated with failing or dropping out of high school (7), school-based antismoking programs and policies should target younger students before they leave school (8,9). The U.S. Department of Health and Human Services recently announced a new initiative to increase access to telephone quitlines. Quitlines provide free counseling and have been shown to be effective in reaching low-income populations (10). Media campaigns also have been shown to reach low-income smokers and increase cessation (4,10). The findings in this report are subject to at least two limitations. First, both the wording of NHIS cigarette smoking questions and NHIS data-collection procedures have changed since 1993. Because of these changes, trend analyses or comparisons of data from before 1993 with data collected since 1993 should be interpreted with caution. Second, because NHIS data for some population subgroups (e.g., American Indians/Alaska Natives) are small, data for a single year might be unreliable. Combining data for several years can produce more accurate estimates for these subpopulations. National health objectives for 2010 focus on eliminating health disparities among population subgroups (1). Closing the gap in smoking prevalence among persons of different socioeconomic strata will require comprehensive tobacco- control programs that discourage smoking initiation and promote smoking cessation among members of populations at high risk. Comprehensive tobacco-control programs at local, state, and national levels must ensure that their intervention efforts reach persons with inadequate resources and limited access to health care. Such efforts should address the needs of the uninsured (e.g., providing treatment through telephone quitlines and in community health centers), increase coverage for tobacco-use treatment under both public and private insurance, and improve workplace and social environments to better support smoking cessation, particularly for low-income and blue-collar workers. References
* Published 2000 poverty thresholds from the U.S. Bureau of the Census were used in these calculations.
Disclaimer All MMWR HTML versions of articles are electronic conversions from ASCII text into HTML. This conversion may have resulted in character translation or format errors in the HTML version. Users should not rely on this HTML document, but are referred to the electronic PDF version and/or the original MMWR paper copy for the official text, figures, and tables. An original paper copy of this issue can be obtained from the Superintendent of Documents, U.S. Government Printing Office (GPO), Washington, DC 20402-9371; telephone: (202) 512-1800. Contact GPO for current prices. **Questions or messages regarding errors in formatting should be addressed to mmwrq@cdc.gov.Page converted: 5/27/2004 |
|||||||||
This page last reviewed 5/27/2004
|