 |
|
|
|
|
|
|
| ||||||||||
|
|
|
|
|
|
|
||||
| ||||||||||
|
|
|
|
|
Persons using assistive technology might not be able to fully access information in this file. For assistance, please send e-mail to: mmwrq@cdc.gov. Type 508 Accommodation and the title of the report in the subject line of e-mail. Public Health and Aging: Nonfatal Injuries Among Older Adults Treated in Hospital Emergency Departments --- United States, 2001Because injuries generally are considered a problem of the young, injuries among older adults (i.e., persons aged >65 years) have received little attention. However, injuries are the eighth leading cause of death among older adults in the United States (1). In 2001, approximately 2.7 million older adults were treated for nonfatal injuries in hospital emergency departments (EDs); the majority of these injuries were the result of falls (1). To characterize nonfatal injuries among older adults, CDC analyzed data from the National Electronic Injury Surveillance System-All Injury Program (NEISS-AIP). This report summarizes the results of that analysis, which indicate differences in type and mechanism of injury by sex, suggesting that prevention programs should be designed and tailored differently for men and women. NEISS-AIP is operated by the U.S. Consumer Product Safety Commission and collects data about initial visits for all types and causes of injuries treated in U.S. EDs, drawing from a nationally representative sample of 66 hospitals selected as a stratified probability sample of hospitals in the United States. Data from these cases are weighted by the inverse of the probability of selection to produce national estimates (2). For this report, annualized estimates were calculated on the basis of weighted data for 36,752 nonfatal injuries among older adults treated in EDs during January--December 2001. U.S. Census Bureau population estimates for 2001 were used to calculate injury rates (3). A direct variance estimation procedure was used to calculate 95% confidence intervals and to account for the complex sample design (2). All nonfatal injuries were classified according to the mechanism of injury (e.g., fall, struck by/against, or motor vehicle crash), diagnosis, primary body part injured, disposition, location of injury, and intent. The diagnosis and intent of the injury were classified according to the most severe injury (4). Injuries of unknown intent were grouped with those classified as unintentional. During 2001, an estimated 935,556 men and 1,731,640 women aged >65 years were treated in EDs for nonfatal injuries. The overall injury rate per 100,000 persons was higher among women (8,466 per 100,000 persons) than among men (6,404). Injury rates increased with age, to 15,272 for women aged >85 years and 11,547 for men aged >85 years. Nearly all injuries (99%) were classified as unintentional/unknown intent (Table). Overall, falls resulted in the highest rates of injury (4,684 per 100,000 persons) and were the most common mechanism of injury, accounting for 62% of all nonfatal injury ED visits in this population. The injury rate from falls was higher among women (5,659) than men (3,319). However, the injury rates for women were lower with certain other types of injuries, such as being struck by/against (588 versus 617), occupying a motor vehicle (525 versus 540), and being cut or pierced (243 versus 488) (Table). The greatest number of nonfatal injuries among older adults were diagnosed as fractures (26%), followed by contusions/abrasions (23%), lacerations (17%), strains/sprains (13%), and internal injuries (5%). Diagnoses varied by sex. Fractures of all parts of the body were more common among women than men (30% versus 19%), and lacerations were more common among men than women (22% versus 14%). The parts of the body affected most were the head/neck (25%) and arms/hands (22%). The majority (82%) of older adults were treated and released; 16% were hospitalized. The ratio of patients treated/released to those hospitalized was lower among women (4.7:1) than men (5.9:1), suggesting women were more often hospitalized after a nonfatal injury. The most common (47%) location for nonfatal injuries was the home (Table). Reported by: KE Kocher, MD, Dept of Emergency Medicine, Univ of Michigan, Ann Arbor. AM Dellinger, PhD, Div of Unintentional Injury Prevention, National Center for Injury Prevention and Control, CDC. Editorial Note:Falls remain the leading cause of both nonfatal and fatal injury among older adults aged >65 years in the United States (1). The findings in this report, which indicate that falls were the most common reason for injury-related ED visits among persons aged >65 years, are consistent with previous studies indicating that approximately 40% of older adults living in community settings (e.g., in private residences or minimally assisted environments) fall each year (5). In this study, 82% of persons aged >65 years were treated and released following injury, compared with 95% of persons aged <65 years. Older adults were more than three times more likely (1,217 per 100,000 persons) to be hospitalized than persons aged <65 years (353) (1). The findings in this report are subject to at least five limitations. First, NEISS-AIP provides national estimates and does not allow for estimates by region, state, or local jurisdiction. Second, injury outcomes are specific to ED visits and do not include subsequent outcomes. Third, NEISS-AIP data reflect only those injuries that were severe enough to require treatment in an ED. Fourth, in cases with multiple injuries, only data regarding the most severe injury are recorded. Finally, data for intent are classified on the basis of information contained in the medical record. Injuries for which intent cannot be determined conclusively from the ED record are grouped with unintentional injuries. The findings in this report can form the basis for targeting prevention efforts to different populations of older adults. For example, exercise can reduce the risk for fall among older adults by 15% (6). Because women are more likely to sustain fall-related injuries, exercise can be an especially important preventive measure for this population. Data from NEISS-AIP can continue to be a source for monitoring trends, evaluating interventions, and characterizing nonfatal injuries among persons aged >65 years. Acknowledgments This report is based on contributions by the U.S. Consumer Product Safety Commission. K Gotsch, P Holmgreen, JL Annest, PhD, Office of Statistics and Programming, National Center for Injury Prevention and Control, CDC. References
Table 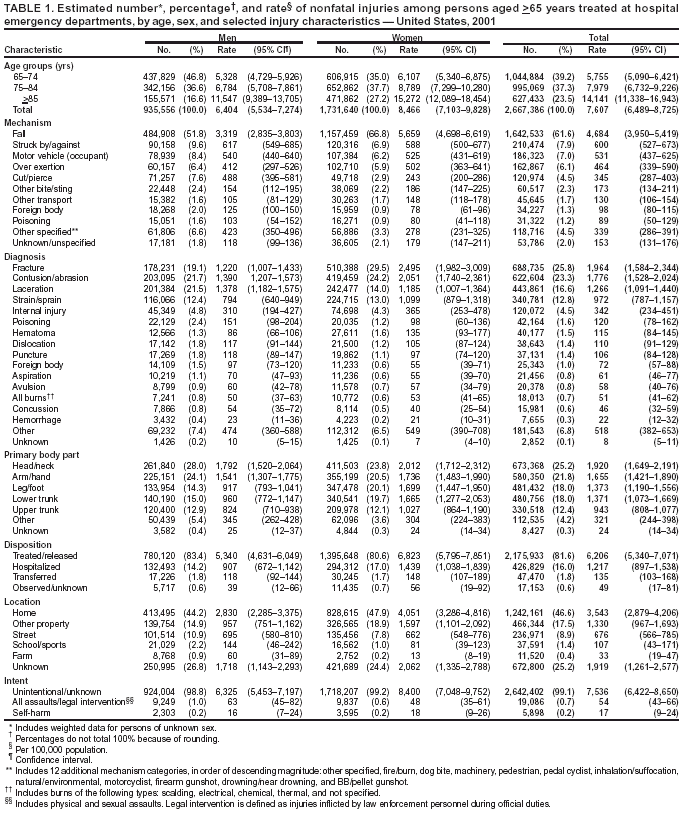 Return to top.
Disclaimer All MMWR HTML versions of articles are electronic conversions from ASCII text into HTML. This conversion may have resulted in character translation or format errors in the HTML version. Users should not rely on this HTML document, but are referred to the electronic PDF version and/or the original MMWR paper copy for the official text, figures, and tables. An original paper copy of this issue can be obtained from the Superintendent of Documents, U.S. Government Printing Office (GPO), Washington, DC 20402-9371; telephone: (202) 512-1800. Contact GPO for current prices. **Questions or messages regarding errors in formatting should be addressed to mmwrq@cdc.gov.Page converted: 10/23/2003 |
|||||||||
This page last reviewed 10/23/2003
|