 |
|
|
|
|
|
|
| ||||||||||
|
|
|
|
|
|
|
||||
| ||||||||||
|
|
|
|
|
Please note:
An
erratum has been published for this article. To view the erratum, please
click here.
Persons using assistive technology might not be able to fully access information in this file. For assistance, please send e-mail to: mmwrq@cdc.gov. Type 508 Accommodation and the title of the report in the subject line of e-mail. Cigarette Smoking Among Adults --- United States, 2001One of the national health objectives for the United States for 2010 is to reduce the prevalence of cigarette smoking among adults to <12% (objective 27.1a) (1). To assess progress toward this objective, CDC analyzed self-reported data from the 2001 National Health Interview Survey (NHIS). The findings of this analysis indicate that, in 2001, approximately 22.8% of U.S. adults were current smokers compared with 25.0% in 1993. During 1965--2001, smoking prevalence declined faster among non-Hispanic blacks aged >18 years than among non-Hispanic whites the same age (Figure). Preliminary data for January--March 2002 indicate a continuing decline in current smoking prevalence among adults overall (2). However, the overall decline in smoking is not occurring at a rate that will meet the national health objective by 2010. Increased emphasis on a comprehensive approach to cessation that comprises educational, economic, clinical, and regulatory strategies is required to further reduce the prevalence of smoking in the United States. The 2001 NHIS adult core questionnaire was administered by personal interview to a nationally representative sample (n = 33,326) of the U.S. civilian, noninstitutionalized population aged >18 years; the overall survey response rate was 73.8%. Respondents were asked, "Have you smoked >100 cigarettes in your entire life?" and those who answered "yes" were asked, "Do you now smoke cigarettes every day, some days, or not at all?" Ever smokers were those who reported having smoked >100 cigarettes during their lifetime. Current smokers were persons who reported both having smoked >100 cigarettes during their lifetime and currently smoking every day or some days. Former smokers were ever smokers who currently did not smoke. Data were adjusted for nonresponses and weighted to provide national estimates of cigarette smoking prevalence. Confidence intervals (CIs) were calculated by using SUDAAN. In 2001, an estimated 46.2 million adults (22.8%; 95% CI = +0.5) were current smokers; an estimated 37.8 million (81.8%) smoked every day, and 8.4 million (18.2%) smoked some days. Of current smokers who smoked every day, an estimated 15.3 million (40.6%; 95% CI = +1.4) had stopped smoking for >1 day during the preceding 12 months because they were trying to quit. In 2001, an estimated 44.7 million adults were former smokers, representing 49.2% (95% CI = +0.9) of persons who had ever smoked. The prevalence of cigarette smoking was higher among men (25.2% [95% CI = +0.8]) than women (20.7%; 95% CI = +0.7) (Table). Among racial/ethnic populations, Asians* (12.4%; 95% CI = +2.6) and Hispanics (16.7%; 95% CI = +1.2) had the lowest prevalence of current smoking; American Indians/Alaska Natives (AI/ANs) had the highest prevalence (32.7%; 95% CI = +7.5). By education level, adults who had earned a General Educational Development diploma (47.8%; 95% CI = +4.2) and those with a grade 9--11 education (34.3%; 95% CI = +2.1) had the highest prevalence of smoking; persons with master's, professional, and doctoral degrees had the lowest prevalence (9.5%; 95% CI = +1.3). Current smoking prevalence was highest among persons aged 18--24 years (26.9%; 95% CI = +1.8) and among those aged 25--44 years (25.8%; 95% CI = +0.8) and lowest among those aged >65 years (10.1%; 95% CI = +0.8). The prevalence of current smoking was higher among adults living below the poverty level† (31.4%; 95% CI = +1.8) than those at or above the poverty level (23.0%; 95% CI = +0.6). Comparing current smoking prevalence data from 1965--1966 and 2000--2001 indicates a slow but steady decrease among non-Hispanic blacks and whites (Figure). Since 1970--1974, prevalence has declined more rapidly among non-Hispanic black men than among non-Hispanic white men. During 2000--2001, for the first time, current smoking prevalence among non-Hispanic black men was similar to that among non-Hispanic white men. Smoking prevalence also declined more rapidly among non-Hispanic black women than non-Hispanic white women. Before 1993--1995, current smoking prevalences among non-Hispanic black and white women generally were comparable, except during 1970--1974, when prevalence among non-Hispanic white women was lower. Since 1993--1995, prevalence among non-Hispanic black women has been lower, except during 1997--1999, when no difference was observed. Reported by: T Woollery, PhD, A Trosclair, MS, C Husten, MD, RC Caraballo, PhD, J Kahende, PhD, Office on Smoking and Health, National Center for Chronic Disease Prevention and Health Promotion, CDC. Editorial Note:The findings in this report indicate that smoking prevalence has declined among adults since 1965. Although selected population groups have met the national health objective for 2010, slow or no progress has been observed in other sections of the U.S. population (3). For this reason, the overall decline in cigarette smoking prevalence in the adult U.S. population is not occurring at a rate that will meet the 2010 national health objective. The findings in this report are subject to at least three limitations. First, questionnaire wording and NHIS data collection procedures have changed since 1993. Because of these changes, trend analyses or comparisons with data from years preceding 1993 should be interpreted with caution. Second, in 1997, the Office of Management and Budget changed its data collection guidelines to require that data on Asians and Native Hawaiians and Other Pacific Islanders be collected separately. For this reason, trend data on smoking prevalence for the combined category of Asians/Pacific Islanders cannot be estimated by using publicly available data. Finally, because NHIS data for some subpopulations (e.g., AI/ANs) are small, data for a single year might be unstable. Combining data from several years would produce more reliable estimates for these subpopulations. Comprehensive tobacco-control programs at the state level have helped to reduce tobacco use (4). In 2000, the U.S. Surgeon General concluded that the 2010 objective could be attained only if comprehensive approaches to tobacco control were implemented (5). In 2002, six states were funding comprehensive programs at the minimum levels recommended by CDC (6). In 2002 and 2003, state budget cuts reduced state support for tobacco-prevention and -cessation programs by $86.2 million (11.2%) (7). To attain the 2010 national health objective, comprehensive tobacco-control programs that meet CDC's recommended funding levels are needed (5,8--10). Within these comprehensive programs, a focus on reducing tobacco use among persons in different socioeconomic strata, racial/ethnic populations, and education levels could help reduce cigarette smoking and tobacco use and reduce the substantial morbidity and mortality and economic costs associated with tobacco use. References
* Excludes Native Hawaiians and Other Pacific Islanders. † Calculated on the basis of U.S. Census Bureau 2000 poverty thresholds. Table 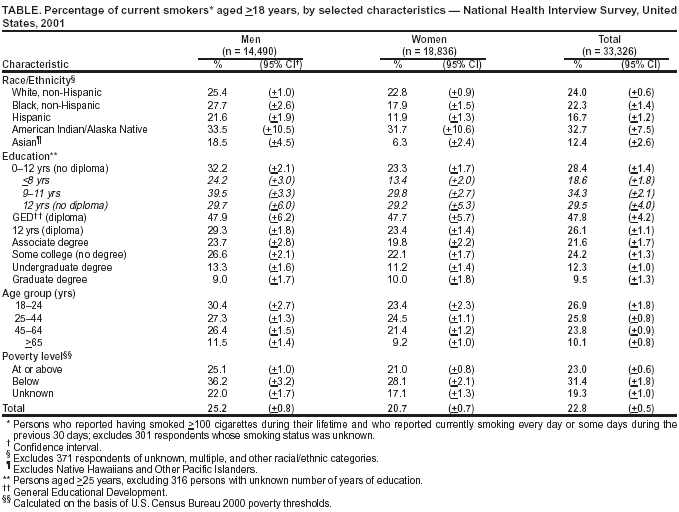 Return to top. Figure 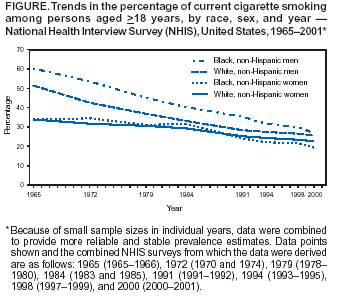 Return to top.
Disclaimer All MMWR HTML versions of articles are electronic conversions from ASCII text into HTML. This conversion may have resulted in character translation or format errors in the HTML version. Users should not rely on this HTML document, but are referred to the electronic PDF version and/or the original MMWR paper copy for the official text, figures, and tables. An original paper copy of this issue can be obtained from the Superintendent of Documents, U.S. Government Printing Office (GPO), Washington, DC 20402-9371; telephone: (202) 512-1800. Contact GPO for current prices. **Questions or messages regarding errors in formatting should be addressed to mmwrq@cdc.gov.Page converted: 10/9/2003 |
|||||||||
This page last reviewed 10/9/2003
|