|
|
|
|
|
|
|
| ||||||||||
|
|
|
|
|
|
|
||||
| ||||||||||
|
|
|
|
|
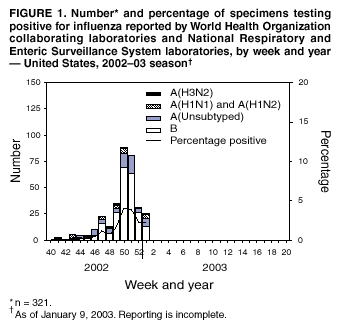
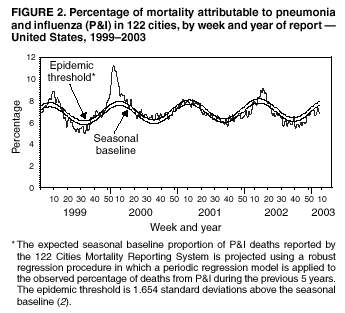
Persons using assistive technology might not be able to fully access information in this file. For assistance, please send e-mail to: mmwrq@cdc.gov. Type 508 Accommodation and the title of the report in the subject line of e-mail. Update: Influenza Activity --- United States, 2002--03 SeasonAlthough overall influenza activity in the United States remained low from late September through early January, it is expected to increase during the coming weeks. Laboratory-confirmed influenza infections have been reported from 25 states. Influenza viruses isolated this season are antigenically well matched by this season's influenza vaccine. This report summarizes influenza activity in the United States during September 29, 2002--January 4, 2003, and updates the previous summary* (1). During September 29--January 4, World Health Organization collaborating laboratories and National Respiratory and Enteric Virus Surveillance System laboratories in the United States tested 23,976 respiratory specimens for influenza viruses; 321 (1.3%) were positive. Weekly percentages of specimens testing positive for influenza ranged from 0 to 4.1% (Figure 1). During the 1999--2000, 2000--01, and 2001--02 influenza seasons, peak percentages of specimens testing positive for influenza ranged from 23% to 31% (2; CDC, unpublished data, 2002). During September 29--January 4, influenza viruses were reported from 25 states; nine states reported only influenza A viruses, five states reported only influenza B viruses, and 11 states reported both. Of the 321 influenza viruses identified since September 29, a total of 90 (28%) were influenza A viruses, and 231 (72%) were influenza B viruses. A total of 133 (58%) of the 231 influenza B viruses were identified from Texas. Of the 90 influenza A viruses, 24 (27%) have been subtyped; 18 (75%) were influenza A(H1)† viruses, and six (25%) were influenza A(H3N2) viruses. CDC has antigenically characterized 42 influenza viruses submitted since September 29 by U.S. laboratories: 26 influenza B viruses, 12 influenza A(H1) viruses, and four influenza A(H3N2) viruses. Eleven of the influenza A(H1) viruses had the N1 neuraminidase, and one had the N2 neuraminidase. The hemagglutinin proteins of influenza A(H1N1) and A(H1N2) viruses, influenza A(H3N2) viruses, and influenza B viruses were similar antigenically to those of the corresponding vaccine strains A/New Caledonia/20/99 (H1N1), A/Panama/2007/99 (H3N2), and B/Hong Kong/330/01, respectively. During September 29--January 4, weekly percentages of patient visits for influenza-like illness (ILI)§ reported by approximately 750 U.S. sentinel providers in 49 states ranged from 1.0% to 2.0%. During the week ending January 4, the percentage of patient visits for ILI was 2.0% (national baseline¶: 1.9%). During the 1999--2000, 2000--01, and 2001--02 influenza seasons, national weekly peak percentages of patient visits for ILI ranged from 3.2% to 5.6% (2; CDC, unpublished data, 2002). Since the week ending October 5, Texas reported widespread influenza activity** for 3 weeks, and 11 states (including Texas) and New York City reported regional activity for >1 week. During the week ending January 4, seven states reported regional influenza activity. During the same week, 6.8% of recorded deaths in the 122 Cities Mortality Reporting System were attributed to pneumonia and influenza (P&I), which is below the epidemic threshold†† of 8.0% for that week (Figure 2). The percentage of P&I deaths has remained below the epidemic threshold for each week during September 29--January 4. Reported by: WHO Collaborating Center for Reference and Research on Influenza; A Postema, MPH, L Brammer, MPH, H Hall, A Klimov, PhD, T Uyeki, MD, K Fukuda, MD, N Cox, PhD, Div of Viral and Rickettsial Diseases, National Center for Infectious Diseases; P Terebuh, MD, EIS Officer, CDC. Editorial Note:Influenza activity was low from late September to early January, except in a few states. However, testing and reporting might be limited during holiday periods, and estimates of recent activity could change as more data become available. Influenza activity is expected to increase during coming weeks. Although more influenza B viruses have been reported than influenza A viruses during the early part of the season (58% of them from Texas), more states have reported influenza A viruses than influenza B viruses. The virus types that will predominate during the remainder of the season are unpredictable. The influenza viruses that have been characterized antigenically to date have been well matched by the vaccine strains. Because vaccination is the best prevention against influenza, CDC encourages continuing vaccination efforts throughout the season, especially among persons at high risk for serious complications from influenza, health-care workers, and contacts of persons at high risk (3). Although estimates of influenza-associated mortality in the United States have increased to an estimated annual average of 36,000 deaths, attributable in part to the aging of the population, influenza-associated mortality varies substantially from year to year, depending on several factors, including the type and subtype of circulating influenza viruses (4). Since the 1990--91 influenza season, the greatest annual mean numbers of deaths have been associated with influenza A(H3N2) viruses, followed by deaths from influenza B viruses and then influenza A(H1N1) viruses (4). Antiviral medications can be useful for early treatment of influenza and as an adjunct to influenza vaccination for prevention and control (3). When administered within 48 hours of symptom onset, antiviral treatment of influenza can reduce the duration of illness by approximately 1 day in healthy adults (5). Of the four prescription antiviral medications (amantadine, rimantadine, oseltamivir, and zanamivir) that are approved for treatment of influenza A virus infections, only oseltamivir (approved for persons aged >1 year) and zanamivir (approved for persons aged >7 years) have activity against influenza B viruses. Antiviral chemoprophylaxis is approximately 70%--90% effective in preventing illness in healthy adults (5,6). Amantadine, rimantadine, and oseltamivir are approved for chemoprophylaxis of influenza A virus infections, but only oseltamivir is approved (for persons aged >13 years) for chemoprophylaxis of influenza B virus infections. Local influenza surveillance data can guide the choice of antiviral medication. Commercially available rapid influenza diagnostic tests can provide supplemental information to guide clinical management of persons with suspected influenza. However, tests differ in their ability to detect or differentiate influenza A and influenza B viruses. The sensitivity of rapid diagnostic tests is lower than viral culture, and a negative test does not exclude the diagnosis of influenza (7,8). An updated summary of commercially available influenza rapid diagnostic tests is available at http://www.cdc.gov/ncidod/diseases/flu/flu_dx_table. Physicians should consult the package inserts (available at http://www.fda.gov/cder/drug/antivirals/influenza/default.htm#drugs) of the antiviral drugs for information on approved age groups, dosing, and adverse effects. Acknowledgment This report is based on data contributed by participating state and territorial epidemiologists and state health laboratories, WHO collaborating laboratories, National Respiratory and Enteric Virus Surveillance System laboratories, U.S. Influenza Sentinel Providers Surveillance System, and Div of Public Health Surveillance and Informatics, Epidemiology Program Office, CDC. References 1. CDC. Update: influenza activity---United States, 2002--03 season. MMWR 2002;51:1095--6. 2. CDC. Surveillance for influenza---United States 1997--98, 1998--99, and 1999--2000. In: CDC surveillance summaries (October 25). MMWR 2002;51(No. SS-7). 3. CDC. Prevention and control of influenza: recommendations of the Advisory Committee on Immunization Practices (ACIP). MMWR 2002;51(No. RR-3). 4. Thompson WW, Shay DK, Weintraub E, et al. Mortality associated with influenza and respiratory syncytial virus in the United States. JAMA 2003;289:179--86. 5. Demicheli V, Jefferson T, Rivetti D, Deeks J. Prevention and early treatment of influenza in healthy adults. Vaccine 2000;18:957--1030. 6. Hayden FG, Atmar RL, Schilling M, et.al. Use of the selective oral neuraminidase inhibitor oseltamivir to prevent influenza. N Engl J Med 1999;341:1336--43. 7. Anonymous. Rapid diagnostic tests for influenza. Med Lett Drugs Ther 1999;41:121--4. 8. Rodriguez W, Schwartz R, Thorne M. Evaluation of diagnostic tests for influenza in a pediatric practice. Pediatr Infect Dis J 2002;21:193--6. * As of January 9, 2003. Reporting is incomplete. † Includes both the A(H1N1) and A(H1N2) influenza virus subtypes. § Temperature of >100.0º F (>37.8º C) and either cough or sore throat in the absence of a known cause. ¶ The national baseline was calculated as the mean percentage of visits for ILI during noninfluenza weeks, plus two standard deviations. Wide variability in regional data precludes calculating region-specific baselines and makes it inappropriate to apply the national baseline to regional data. ** Levels of activity: 1) no activity, 2) sporadic---sporadically occurring ILI or laboratory-confirmed influenza with no outbreaks detected, 3) regional---outbreaks of ILI or laboratory-confirmed influenza in counties with a combined population of <50% of a state's population, and 4) widespread---outbreaks of ILI or laboratory-confirmed influenza in counties with a combined population of >50% of a state's population. †† The expected seasonal baseline proportion of P&I deaths reported by the 122 Cities Mortality Reporting System is projected using a robust regression procedure in which a periodic regression model is applied to the observed percentage of deaths from P&I during the previous 5 years. The epidemic threshold is 1.654 standard deviations above the seasonal baseline (2).
|
Use of trade names and commercial sources is for identification only and does not imply endorsement by the U.S. Department of
Health and Human Services. |
Disclaimer All MMWR HTML versions of articles are electronic conversions from ASCII text into HTML. This conversion may have resulted in character translation or format errors in the HTML version. Users should not rely on this HTML document, but are referred to the electronic PDF version and/or the original MMWR paper copy for the official text, figures, and tables. An original paper copy of this issue can be obtained from the Superintendent of Documents, U.S. Government Printing Office (GPO), Washington, DC 20402-9371; telephone: (202) 512-1800. Contact GPO for current prices.
**Questions or messages regarding errors in formatting should be addressed to mmwrq@cdc.gov.Page converted: 1/16/2003
|
|
|||||
|
HOME |
ABOUT MMWR |
MMWR SEARCH |
DOWNLOADS |
RSS
|
CONTACT
|
|||||
|
|
|||||
|
This page last reviewed 1/16/2003