|
|
|
|
|
|
|
| ||||||||||
|
|
|
|
|
|
|
||||
| ||||||||||
|
|
|
|
|
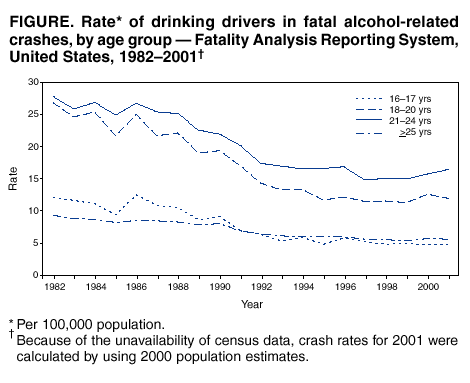
Persons using assistive technology might not be able to fully access information in this file. For assistance, please send e-mail to: mmwrq@cdc.gov. Type 508 Accommodation and the title of the report in the subject line of e-mail. Involvement by Young Drivers in Fatal Alcohol-Related Motor-Vehicle Crashes --- United States, 1982--2001Motor-vehicle crashes are the leading cause of death in the United States for persons aged 16--24 years, and a substantial proportion of these crashes are alcohol-related. Alcohol-impaired driving is highest among persons aged 21--24 years (1), and the percentage of fatal crashes that are alcohol-related is highest for this age group (2). However, alcohol-related crashes are a serious problem even for the youngest drivers. Not only are drivers aged <21 years more likely than older drivers to be involved in fatal crashes, but their added risk for fatal crash involvement increases more sharply at all levels of alcohol use (3). To characterize the rate of alcohol-related fatal crashes among young drivers, CDC analyzed unpublished data from the Fatality Analysis Reporting System (FARS), a national database of information on fatal crashes. The findings indicate that the largest decrease in alcohol-related fatal crashes during 1982--2001 was among drivers aged <21 years, who have been the target of several interventions to reduce alcohol-impaired driving. Public health and traffic safety professionals should ensure that communities implement comprehensive and effective strategies to reduce alcohol-impaired driving. FARS contains data on a census of fatal traffic crashes within the United States. To be included in FARS, a crash must occur on a public road and result in a death within 30 days of the crash. Trend data for alcohol-related fatal crash rates for 1982--2001 are presented for four age groups: 16--17 years, 18--20 years, 21--24 years, and >25 years. Data on older drivers are presented for comparison. Drivers are considered alcohol-involved if their blood alcohol concentration (BAC) was >0.01 g/dL. When BACs are unavailable, they are imputed from driver and crash characteristics by using a two-stage estimation procedure (4)*. Crash rates are calculated by dividing the number of alcohol-involved crashes for each age group by the census estimate for the number of U.S. residents in that age group (per 100,000 population) (6). During 1982--2001, fatal crash involvement by drinking drivers decreased 46% (95% confidence interval [CI]=-48%---45%) (Figure). The most dramatic decreases were among drivers aged <21 years. Fatal alcohol-related crash rates decreased 60% (95% CI=-65%-- -56%) for drivers aged 16--17 years, 55% (95% CI=-58%-- -52%) for drivers aged 18--20 years, 41% (95% CI=-44%-- -38%) for drivers aged 21--24 years, and 39% (95% CI=-41%-- -38%) for drivers aged >25 years. These decreases had been achieved by 1997 (48% overall decrease, 95% CI=-49%-- -47%), when the trend began to level off. Since 1999, rates have increased slightly for all age groups except those aged 16--17 years (16--17 years:-3%, 95% CI=-16%--11%; 18--20 years: 6%, 95% CI=-2%--14%; 21--24 years: 10%, 95% CI=3%--16%; >25 years: 4%, 95% CI=1%--7%). Despite the overall decreases, alcohol-related crashes resulted in 17,448 fatalities during 2001. The risks for involvement in alcohol-related fatal crashes remain high for young drivers, particularly when driving exposure is considered. For example, in 1996, rates of involvement in alcohol-related fatal crashes were similar for drivers aged 16--17 years and those aged >25 years (5.8 versus 6.0 per 100,000 population); in comparison, their risk was approximately three times greater per mile driven (1.6 per 100,000,000 vehicle miles traveled [VMT] versus 0.6 VMT) (6,7). Reported by: RW Elder, MEd, RA Shults, PhD, Div of Unintentional Injury Prevention, National Center for Injury Prevention and Control, CDC. Editorial Note:During 1982--2001, rates of alcohol-related fatal crashes decreased substantially across all age groups, with the largest decrease among drivers aged <21 years. These drivers were recognized increasingly as a high-risk group during the 1970s, when many states lowered their legal drinking age and alcohol-related crashes increased. Subsequently, targeted interventions were implemented to reduce rates of alcohol-impaired driving. The 1984 Uniform Drinking Age Act required states to adopt a minimum legal drinking age of 21 years by 1988. Other interventions targeted directly at young drivers include "zero tolerance" BAC standards for drivers under the legal drinking age and graduated driver licensing programs, which require new drivers to progress through stages, allowing them increased driving priviledges as they gain experience. Other factors that have probably reduced overall levels of drinking and driving include new laws and policies, stronger law enforcement, community-based education and advocacy programs, and shifts in social norms about alcohol consumption and the acceptability of alcohol-impaired driving (8). The findings in this report are subject to at least two limitations. First, BAC data are imputed for approximately 60% of FARS cases in any given year (4), decreasing the precision of the alcohol-related crash rates used in this analysis. Second, although alcohol is an important risk factor for traffic crashes, it is not necessarily the primary cause of every crash in which it is measured or imputed. Despite these limitations, the alcohol-related crashes reported in FARS are among the best available indices for measuring progress in reducing alcohol-impaired driving. To further decrease alcohol-related fatal crashes among both young drivers and the general population, communities need to implement interventions that are known to be effective. CDC, in cooperation with the Task Force on Community Preventive Services, has completed a series of systematic reviews of several interventions for reducing alcohol-impaired driving. The Task Force has recommended that states maintain and enforce minimum legal drinking age laws and "zero tolerance" laws for young drivers. It also recommended the implementation of sobriety checkpoints, 0.08% BAC laws, and training programs for servers of alcoholic beverages (9,10). Public health and traffic safety professionals should collaborate to ensure that every community has a comprehensive and effective strategy to resume the downward trend in alcohol-impaired driving. References
* This model produces estimates that are not comparable to those produced by the imputation procedure used by FARS before 2002 (5).
|
Use of trade names and commercial sources is for identification only and does not imply endorsement by the U.S. Department of
Health and Human Services. |
Disclaimer All MMWR HTML versions of articles are electronic conversions from ASCII text into HTML. This conversion may have resulted in character translation or format errors in the HTML version. Users should not rely on this HTML document, but are referred to the electronic PDF version and/or the original MMWR paper copy for the official text, figures, and tables. An original paper copy of this issue can be obtained from the Superintendent of Documents, U.S. Government Printing Office (GPO), Washington, DC 20402-9371; telephone: (202) 512-1800. Contact GPO for current prices.
Page converted: 12/5/2002
|
|
|||||
|
HOME |
ABOUT MMWR |
MMWR SEARCH |
DOWNLOADS |
RSS
|
CONTACT
|
|||||
|
|
|||||
|
This page last reviewed 12/5/2002