|
|
|
|
|
|
|
| ||||||||||
|
|
|
|
|
|
|
||||
| ||||||||||
|
|
|
|
|
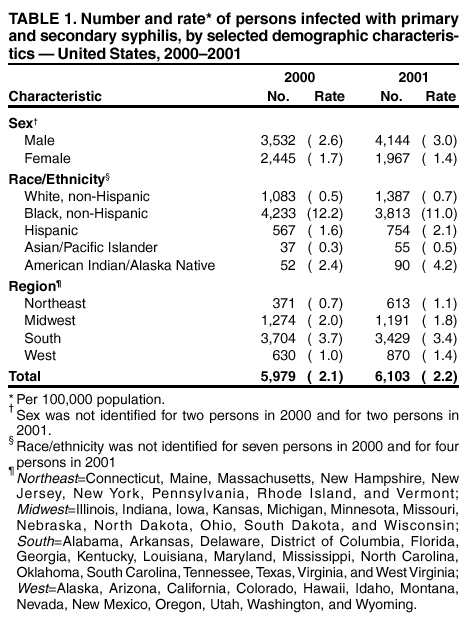
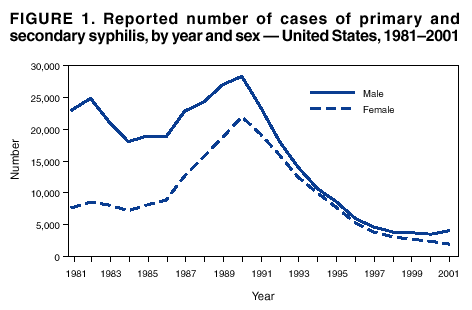
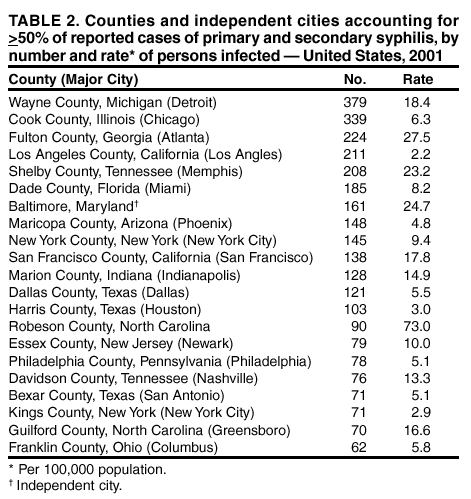
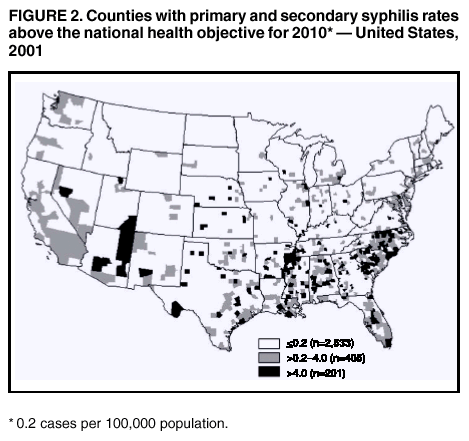
Persons using assistive technology might not be able to fully access information in this file. For assistance, please send e-mail to: mmwrq@cdc.gov. Type 508 Accommodation and the title of the report in the subject line of e-mail. Primary and Secondary Syphilis --- United States, 2000--2001In October 1999, CDC, in collaboration with other federal partners, initiated the National Plan to Eliminate Syphilis in the United States. Syphilis elimination is defined as the absence of sustained transmission (i.e., no transmission after 90 days of the report of an imported index case). The national goals for syphilis elimination are to reduce the annual number of primary and secondary (P&S) syphilis cases to <1,000 cases (rate: 0.4 per 100,000 population) and to increase the number of syphilis-free counties to 90% by 2005 (1). To characterize the epidemiology of syphilis in the United States, CDC analyzed national notifiable disease surveillance data for 2000--2001. This report summarizes the results of that analysis, which indicate that the number of reported cases of P&S syphilis increased slightly in 2001. This increase occurred only among men; the number of P&S syphilis cases continued to decline among women and among non-Hispanic blacks. The available data indicate that syphilis cases occurring among men who have sex with men (MSM) contributed to the increase in cases. The data suggest that, although efforts to reduce syphilis among women and non-Hispanic blacks appear effective and should continue, efforts to prevent and treat syphilis among MSM need to be improved. Data for syphilis cases reported to state health departments and the District of Columbia during 2000--2001 were sent weekly to CDC. These data included information about each patient's county of residence, sex, stage of disease, racial/ ethnic group, and age group. Data on reported cases of P&S syphilis were analyzed for this report because these cases represented incidence (i.e., newly acquired infections within the evaluated time) better than reported cases of latent infection, which were acquired months or years before diagnosis. P&S syphilis rates were calculated by using population denominators from the U.S. Bureau of the Census; the 2001 rates and numbers of cases were compared with 2000 data (2). After declining every year since 1990, the number of reported cases of P&S syphilis increased slightly in 2001. In 2000, the rate of P&S syphilis in the United States declined to 2.1 cases per 100,000 population, the lowest rate since reporting began in 1941 (2). In 2001, the rate of P&S syphilis increased slightly, to 2.2, the first annual rate increase since 1990, and 6,103 cases of P&S syphilis were reported, a 2.1% increase in reported cases compared with 2000 (Table 1). In 2001, rates of P&S syphilis were 114.3% higher for men than for women. During 2000--2001, the rate increased 15.4% among men and decreased 17.6% among women; the male-to-female P&S syphilis case ratio increased 50% (from 1.4:1 to 2.1:1) (Figure 1). Increases in male-to-female case ratios occurred among all racial/ethnic groups. In 2001, the rate of P&S syphilis among non-Hispanic blacks was 15.7 times the rate reported among non-Hispanic whites. Non-Hispanic blacks accounted for 62.5% of cases in 2001 and 70.9% in 2000. During 2000--2001, the rate among non-Hispanic blacks declined 9.8%, reflecting a 3.5% decrease in the number of cases among men (from 2,371 to 2,289) and an 18.1% decrease among women (from 1,864 to 1,523). The rate among non-Hispanic whites increased 40.0%; cases among men increased 63.0% (from 698 to 1,138), and cases among women decreased 35.3% (from 385 to 249). The rate among Hispanics increased 31.0%; cases among men increased 50.1% (from 405 to 608), and cases among women decreased 9.3% (from 162 to 147). The rate among Asians/Pacific Islanders increased 66.7%; cases among men increased 79.3% (from 29 to 52), and cases among women decreased from eight to four. The rate among American Indians/Alaska Natives increased 75.0%; cases increased among men (from 26 to 49) and women (from 26 to 41). By region*, the South had the highest rate, accounting for 56.2% of cases occurring in 2001 and 62.0% in 2000. During 2000--2001, rates decreased 8.1% in the South and 10.0% in the Midwest but increased 40.0% in the West and 57.1% in the Northeast. Rates decreased in 16 states, remained the same in nine states, and increased in 25 states and the District of Columbia. In 2001, no cases of P&S syphilis were reported in 2,516 (80.2%) of 3,139 U.S. counties, and 2,533 (80.7%) counties reported rates less than or equal to the national health objective for 2010 of 0.2 cases per 100,000 persons (objective no. 25-3) (Figure 2) (3). In 2001, 20 counties and one city accounted for 50.6% of all reported P&S syphilis cases in the United States (Table 2). During 2000--2001, the overall rate for 63 of the largest cities in the U.S. with >200,000 population increased 9.1%, from 4.4 per 100,000 persons to 4.8. Reported by: State and local health depts. JD Heffelfinger, MD, HS Weinstock, MD, SM Berman, MD, EB Swint, MS, Div of Sexually Transmitted Disease Prevention, National Center for HIV, STD, and TB Prevention, CDC. Editorial Note:The pattern of syphilis infection in the United States has changed during recent years. Although the South continues to have the highest rate of P&S syphilis, disease was less concentrated in this region. Racial/ethnic disparities in syphilis rates are decreasing because of declining rates among non-Hispanic blacks and increasing rates among non-Hispanic whites. During 2000--2001, the number of cases of P&S syphilis increased among men, ending the decade-long trend characterized by annual declines in syphilis cases among both men and women. This increase in syphilis cases among men is associated with reports in several cities of syphilis outbreaks among MSM (4--9); these outbreaks were characterized by high rates of human immunodeficiency virus co-infection and high-risk sexual behavior among subpopulations of MSM. Although syphilis cases reported nationally do not include information on behavior risk, the continuing decline in syphilis rates among women in conjunction with the increasing male-to-female case ratio suggests that the syphilis rate probably is increasing among MSM and decreasing among heterosexual men. The findings in this report are subject to at least two limitations. First, the quality of surveillance data vary at local and state levels, and syphilis reporting is incomplete. Second, because cases among patients attending public-sector clinics might be more likely to be reported than cases diagnosed in the private sector and persons of minority race/ethnicity might be more likely to attend public clinics, the racial/ ethnic differences in reported rates might be magnified. The National Syphilis Elimination Plan announced by CDC in 1999 focused initially on reducing syphilis in the South and among minority populations. Rates of syphilis in the South and among non-Hispanic blacks and women have declined every year since 1997. Ensuring continued progress toward syphilis elimination will require that syphilis trends be monitored and that elimination efforts be maintained among these populations. However, the increase in cases among MSM underscores the need to modify the syphilis elimination plan to develop and implement more effective prevention activities among MSM (7). National efforts are under way to collect information on behavior to permit better monitoring of syphilis trends among MSM and heterosexual persons, study ethnographic and other factors associated with increases in syphilis among MSM, and improve programs to prevent and treat syphilis. To sustain progress toward syphilis elimination, communities must understand local patterns of syphilis transmission and develop effective, targeted intervention strategies that include education, risk reduction, and appropriate screening and treatment of persons at risk for this disease. References
* Northeast=Connecticut, Maine, Massachusetts, New Hampshire, New Jersey, New York, Pennsylvania, Rhode Island, and Vermont; Midwest=Illinois, Indiana, Iowa, Kansas, Michigan, Minnesota, Missouri, Nebraska, North Dakota, Ohio, South Dakota, and Wisconsin; South=Alabama, Arkansas, Delaware, District of Columbia, Florida, Georgia, Kentucky, Louisiana, Maryland, Mississippi, North Carolina, Oklahoma, South Carolina, Tennessee, Texas, Virginia, and West Virginia; West=Alaska, Arizona, California, Colorado, Hawaii, Idaho, Montana, Nevada, New Mexico, Oregon, Utah, Washington, and Wyoming.
|
Use of trade names and commercial sources is for identification only and does not imply endorsement by the U.S. Department of
Health and Human Services. |
Disclaimer All MMWR HTML versions of articles are electronic conversions from ASCII text into HTML. This conversion may have resulted in character translation or format errors in the HTML version. Users should not rely on this HTML document, but are referred to the electronic PDF version and/or the original MMWR paper copy for the official text, figures, and tables. An original paper copy of this issue can be obtained from the Superintendent of Documents, U.S. Government Printing Office (GPO), Washington, DC 20402-9371; telephone: (202) 512-1800. Contact GPO for current prices.
Page converted: 10/31/2002
|
|
|||||
|
HOME |
ABOUT MMWR |
MMWR SEARCH |
DOWNLOADS |
RSS
|
CONTACT
|
|||||
|
|
|||||
|
This page last reviewed 10/31/2002