|
|
|
|
|
|
|
| ||||||||||
|
|
|
|
|
|
|
||||
| ||||||||||
|
|
|
|
|
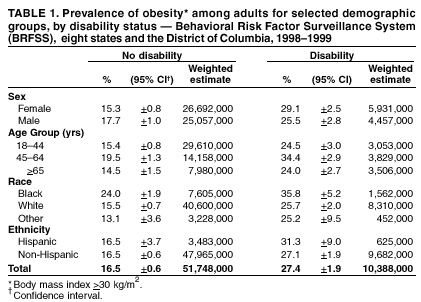
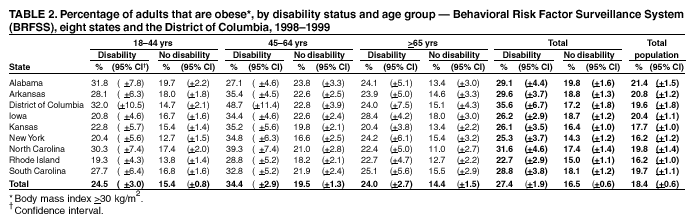
Persons using assistive technology might not be able to fully access information in this file. For assistance, please send e-mail to: mmwrq@cdc.gov. Type 508 Accommodation and the title of the report in the subject line of e-mail. State-Specific Prevalence of Obesity Among Adults with Disabilities --- Eight States and the District of Columbia, 1998--1999The national health objectives for 2010 rank obesity among the top ten leading health indicators (1). Obesity increases the risk for type 2 diabetes, hypertension, dyslipidemia, cardiovascular disease, respiratory problems, certain cancers, gallstones, osteoarthritis, and lowered life expectancy (2--4). The estimated annual cost attributable to obesity-related diseases is approximately $100 billion (5). Obesity among adults in the general U. S. population increased from 12.0% in 1991 to 17.9% in 1998 (6). Little is known about the national or state prevalence of obesity among persons with disabilities. Obesity is not measured routinely or reported among persons with disabilities (1). To determine the prevalence of obesity among persons with and without disabilities, CDC analyzed data from the 1998 and 1999 Behavioral Risk Factor Surveillance System (BRFSS) for eight states and the District of Columbia (DC). The findings indicate that obesity rates are significantly higher among persons with disabilities, especially among blacks and persons aged 45--64 years. The findings suggest that public health messages and interventions should be targeted to persons with disabilities who are likely to become obese and to obese persons who are likely to become disabled. BRFSS is an ongoing, random-digit--dialed telephone survey of the noninstitutionalized U.S. population aged >18 years. The survey consists of a list of questions, including self-reported height and weight, indicators used to calculate body mass index (BMI) (weight in kilograms divided by height in meters squared [weight (kg)/height squared (m2)]. Obesity is defined as BMI >30.0 kg/m2 (5). For this analysis, data from the 1998 and 1999 BRFSS were aggregated to increase the precision of prevalence estimates. Disability-identifying questions were asked to 52,037 respondents in eight states (Alabama, Arkansas, Iowa, Kansas, New York, North Carolina, Rhode Island, and South Carolina) and DC. Disability was defined on the basis of a qualifying response to either of the following two questions: "Are you limited in any way in any activities because of an impairment or health problem?" or "If you use special equipment or help from others to get around, what type do you use?" Responses to type of assistance included wheelchair, walker, cane, or another person. Responses of "don't know" and "not sure" were coded as missing values. Previous analysis indicated wide variation in disability prevalence by state (7). BRFSS data for 1998 show rates of disability ranging from 13.6% to 21.8%, with an overall age-adjusted rate of 17.1% in 11 states and DC. Prevalence of disability increased with age; 9.7% of those aged 18--44 years, 22.1% of those aged 45--64 years, and 30.8% of those aged >65 years reported disability (7). Samples were weighted for age, sex, race/ethnicity, and nonresponse to the survey to estimate the noninstitutionalized civilian population of each state. SUDAAN was used to account for the multistage, stratified samples of this survey and to calculate 95% confidence intervals (CIs). Response rates calculated for participating states using the CASRO method (8) for 1998 ranged from 52.2% (New York) to 75.1% (Kansas) with a median of 60.9%; in 1999, response rates ranged from 45.0% (New York) to 66.3% (Kansas) with a median of 49.6% for the eight states and DC. The sample size resulted in estimates for a weighted population of 62,137,000 persons. Of the total population surveyed, 18.4% were obese (Table 1). Overall, and for each of the four demographic characteristics examined, persons with disabilities had higher rates of obesity (27.4% [95% CI=25.5--29.3]) than those without disabilities (16.5% [95% CI=15.9--17.1]). Substantial differences existed between men with disabilities (25.5% [95% CI=22.7--28.3]) and without disabilities (17.7% [95% CI=16.7--18.7]) and between women with disabilities (29.1% [95% CI=26.6--31.6]) and without disabilities (15.3% [95% CI=14.5--16.1]) (Table 2). In the population without disability, a slight but significantly higher percentage of men than women reported obesity; however, among those with a disability, a larger percentage of women than men tended to report obesity. A significantly larger percentage of blacks with disabilities reported obesity compared with whites with disabilities. Among whites, 25.7% (95% CI=23.7--27.7) of those with disability reported obesity, compared with 35.8% (95% CI=30.6--41.0) among blacks and 31.1% (95% CI=22.3--40.3) among Hispanics. Significant differences were found in the percentages of persons with and without disabilities for the three age groups; however, the differences were greatest for those aged 45--64 years. A total of 34.4% (95% CI=31.5--37.3) of persons with disabilities in this age group reported obesity compared with 19.5% (95% CI=18.2--20.8) of persons without disabilities. The estimated prevalence of obesity among persons reporting disabilities varied by state (Table 2). Overall, rates ranged from 22.7% (95% CI=19.8--25.6) in Rhode Island to 35.6% (95% CI=28.9--42.3) in DC. For women, rates ranged from 26.2% (95% CI=22.2--30.2) in Rhode Island to 35.4% (95% CI=19.8--41.0) in Alabama. For men, rates ranged from 22.7% (95% CI=19.8--25.6) in Rhode Island to 35.6% (95% CI=28.9--42.3) in DC. In three states (Alabama, Iowa, and Rhode Island), obesity rates among men with and without disabilities were similar. However, among men with disabilities in DC, men aged 18--44 and 45--64 years were three times more likely to be obese (13.7% versus 36.8% and 16.7% versus 48.7%, respectively). Reported by: VA Campbell, PhD, JE Crews, DPA, L Sinclair, MPH, Div of Human Development and Disability, National Center on Birth Defects and Developmental Disabilities, CDC. Editorial Note:The findings in this report indicate that in these eight states, persons with disabilities, regardless of sex, race/ethnicity, or age, have higher rates of obesity than persons without disabilities. These data indicate that obesity is frequently comorbid with disability and underscore both the public health implications of obesity among persons with disabilities and the need to develop public health policies (9) and interventions to prevent or reduce serious weight problems among this population. These are the first state-level data obtained from BRFSS to estimate the rates of obesity among persons with disabilities. However, additional information is needed about the antecedents and consequences of obesity and disability. The cross-sectional design of BRFSS precludes determining whether respondents became obese before or after developing a disability. The prevalence of obesity observed in this survey is similar to findings of an analysis of BRFSS data about obesity in the general population (6). National Health and Nutrition Examination Survey data, which calculate BMI based on actual measures, indicate that 23% of persons without disabilities are obese compared with 30% of persons with disabilities. The findings in this report are subject to at least four limitations. First, because BRFSS does not sample persons aged <18 years or persons who are in institutions, who are in households without a telephone, who are hearing impaired, who have cognitive, speech, and other communication impairments, or who have limited stamina and cannot get to the telephone, findings in this report cannot be generalized to the U.S. population. Second, the sample size for specific racial/ethnic groups was too small to make reliable state-specific generalizations. Third, the survey data are self-reported; such indicators of activity limitations and compensatory strategies used to identify persons with disabilities have not been validated as measures of disability, and persons might not report height and weight accurately, thus affecting the calculation of BMI (10). Finally, CASRO rates for 1999 were substantially lower than those for 1998; although weighting controls for nonresponse, caution should be exercised in the interpretation of results because missing data from nonparticipants might vary from those provided by survey respondents. Interventions for obesity should address lifestyle, nutrition, physical activity, and access to facilities designed to promote fitness. Additional data are needed about contributors to obesity among persons with disabilities, including dietary and lifestyle decisions; available food choices; physical activity; use of home-, school-, work-, and community-based fitness facilities; and participation in recreational activities. References
|
Use of trade names and commercial sources is for identification only and does not imply endorsement by the U.S. Department of
Health and Human Services. |
Disclaimer All MMWR HTML versions of articles are electronic conversions from ASCII text into HTML. This conversion may have resulted in character translation or format errors in the HTML version. Users should not rely on this HTML document, but are referred to the electronic PDF version and/or the original MMWR paper copy for the official text, figures, and tables. An original paper copy of this issue can be obtained from the Superintendent of Documents, U.S. Government Printing Office (GPO), Washington, DC 20402-9371; telephone: (202) 512-1800. Contact GPO for current prices.
**Questions or messages regarding errors in formatting should be addressed to mmwrq@cdc.gov.Page converted: 9/12/2002
|
|
|||||
|
HOME |
ABOUT MMWR |
MMWR SEARCH |
DOWNLOADS |
RSS
|
CONTACT
|
|||||
|
|
|||||
|
This page last reviewed 9/12/2002