|
|
|
|
|
|
|
| ||||||||||
|
|
|
|
|
|
|
||||
| ||||||||||
|
|
|
|
|
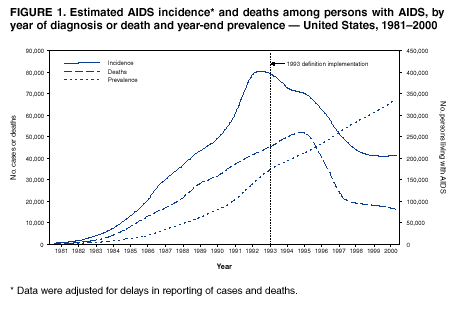
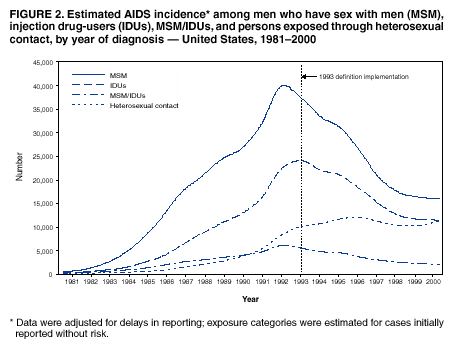
Persons using assistive technology might not be able to fully access information in this file. For assistance, please send e-mail to: mmwrq@cdc.gov. Type 508 Accommodation and the title of the report in the subject line of e-mail. Update: AIDS --- United States, 2000Since the implementation of highly active antiretroviral therapy (HAART) in the United States in 1996, the number of persons diagnosed with acquired immunodeficiency syndrome (AIDS) and the number of deaths among persons with AIDS have declined substantially (1); as a result, the number of persons living with AIDS has increased. This report describes changes in AIDS incidence, prevalence, and deaths among persons with AIDS during January 1996--December 2000. Surveillance data indicate a slowing of declines in new AIDS diagnoses, continued declines in deaths among persons with AIDS, and increases in the number of persons living with AIDS. These findings indicate that AIDS continues to place a burden on the health-care system in the United States and that access to medical and preventive services must be improved to reduce the public health impact of AIDS. AIDS surveillance is conducted in all states, the District of Columbia, and U.S. territories; cases are reported to CDC by using a standard definition and form. In addition, most states conduct human immunodeficiency virus (HIV) surveillance (2). To estimate AIDS incidence and deaths of persons with AIDS through December 2000, CDC adjusted reported cases for reporting delays (3). The HIV-exposure categories for cases reported initially without risk were estimated from historical patterns of risk ascertainment and reclassification. AIDS prevalence was estimated by subtracting cumulative deaths from cumulative AIDS incidence (4). AIDS incidence increased rapidly throughout the 1980s, peaked in the early 1990s, and then declined (Figure 1). The peak of new diagnoses in 1993 was associated with expansion of the AIDS surveillance case definition (5). In 1996, sharp declines in AIDS incidence were observed for the first time; during 1998--1999, declines in AIDS incidence began to level. During 1999--2000, essentially no change in AIDS incidence was observed; an estimated 40,907 new AIDS cases were diagnosed in 1999 and an estimated 41,113 in 2000. During 1996--2000, AIDS incidence declined in the West; declined and then leveled in the South, Midwest, and U.S. territories; and declined and then increased in the Northeast. During the same period, AIDS incidence declined sharply and then slowed among whites and declined more slowly and then leveled among blacks, Hispanics, and Asians/ Pacific Islanders; during 1998--1000, incidence increased among American Indians/Alaska Natives from 152 in 1998 to 183 in 2000 (4). AIDS incidence declined sharply and then slowed among men who have sex with men (MSM) and injection-drug users (IDUs); incidence continued to decline among MSM who also were IDUs. Among persons exposed through heterosexual contact, incidence declined slowly during 1996--1998 and then increased from 10,258 in 1999 to 11,136 in 2000 (Figure 2). During 1996--1997, the estimated number of deaths among persons with AIDS declined 42%; during 1998--2000, declines were smaller (5% during 1998--1999 and 10% during 1999--2000) (Table). During 1996--2000, the number of deaths declined in the Northeast, West, and Midwest; during 1996--1999, deaths declined in the South and U.S. territories, and then leveled during 1999--2000. The number of deaths declined in all racial/ethnic groups and among MSM, male and female IDUs, and MSM/IDUs. During 1996--1998, the number of deaths among men and women with AIDS attributed to heterosexual contact declined and then leveled during 1999--2000 (Table). AIDS prevalence has increased steadily over time; as of December 31, 2000, an estimated 337,731 persons in the United States were living with AIDS (Figure 1). Of these, an estimated 139,522 (41%) were black, 127,838 (38%) white, 65,991 (20%) Hispanic, 2,841 (1%) Asians/Pacific Islanders, and 1,180 (<1%) American Indians/Alaska Natives. An estimated 129,333 (38%) lived in the South, 99,482 (29%) in the Northeast, 66,085 (20%) in the West, 32,909 (10%) in the Midwest, and 9,922 (3%) in U.S. territories. Of the estimated 264,149 adult and adolescent (i.e., person aged >13 years) males living with AIDS, approximately 151,325 (57%) were MSM, 64,522 (24%) were IDUs, and 20,528 (8%) were MSM/IDUs; 23,333 (9%) were exposed through heterosexual contact. Of the estimated 69,775 adult and adolescent women living with AIDS, 40,051 (57%) were exposed through heterosexual contact, and 27,475 (39%) were IDUs. An estimated 3,807 children aged <13 years were living with AIDS; of these, approximately 90% were infected perinatally. Reported by: RM Klevens, JJ Neal, Div of HIV/AIDS Prevention, National Center for HIV, STD and TB Prevention, CDC. Editorial Note:During 1996--2000, AIDS incidence declined or leveled in most geographic regions and among most racial/ethnic groups and HIV-exposure categories; incidence increased slightly among persons exposed heterosexually and among persons living in the Northeast (4). Although the number of deaths among persons with AIDS declined during 1996--2000, the magnitude of decline varied by region and exposure category; the number of deaths declined among persons with AIDS in all racial/ethnic groups. Declines in AIDS incidence and deaths are associated primarily with the widespread use of HAART, which slows progression of HIV infection to AIDS and of AIDS to death (1,6). Because effective therapy increases AIDS-free survival rates among persons living with HIV, new AIDS diagnoses increasingly represent persons who have failed HAART or have limited access to or use of HIV testing or of appropriate medical care and social services. Monitoring the entire spectrum of HIV disease, including the number of new HIV infections, progression of HIV infection to AIDS, and deaths among persons with AIDS, is critical for evaluating prevention efforts aimed at reducing the number of new HIV infections and preventing morbidity and mortality among persons living with HIV. As of December 2000, an estimated 340,000 persons in the United States were living with AIDS. Increasing proportions of persons living with AIDS are black or Hispanic, female, residents of the South, and persons exposed to HIV through heterosexual contact. This finding is consistent with other studies that indicate HIV and AIDS affect disproportionately subgroups that traditionally have had limited access to medical and preventive services because of poverty and social disadvantage (1). This is particularly important for interpreting trends in AIDS because access to high-quality medical services facilitates early treatment of HIV infection and can delay the onset of AIDS. Many persons in historically disadvantaged groups might lack access to or not seek adequate health-care services. An estimated one fourth of persons living with HIV in the United States are not aware of their infection and their need for services, and one third of persons who are aware of their infection are not receiving care (7). Efforts to meet the preventive service and health-care needs of persons living with HIV/AIDS are imperative to improving their quality of life and preventing further transmission of HIV. For the United States to meet the national goal of reducing new HIV infections by half by 2005 (8), improved access to and use of HIV testing and other preventive services, access to care and comprehensive services, and improvements in HIV therapies (1) are required. References
Figure 1
Disclaimer All MMWR HTML versions of articles are electronic conversions from ASCII text into HTML. This conversion may have resulted in character translation or format errors in the HTML version. Users should not rely on this HTML document, but are referred to the electronic PDF version and/or the original MMWR paper copy for the official text, figures, and tables. An original paper copy of this issue can be obtained from the Superintendent of Documents, U.S. Government Printing Office (GPO), Washington, DC 20402-9371; telephone: (202) 512-1800. Contact GPO for current prices. **Questions or messages regarding errors in formatting should be addressed to mmwrq@cdc.gov.Page converted: 7/11/2002 |
|||||||||
This page last reviewed 7/11/2002
|