|
|
|
|
|
|
|
| ||||||||||
|
|
|
|
|
|
|
||||
| ||||||||||
|
|
|
|
|
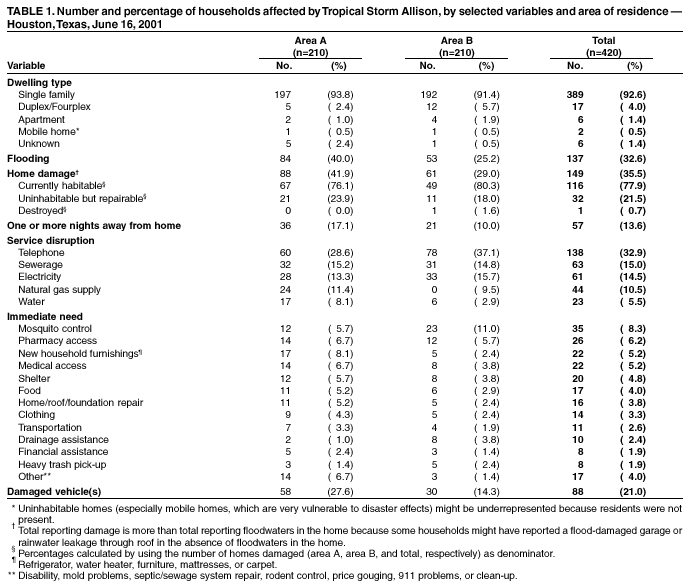
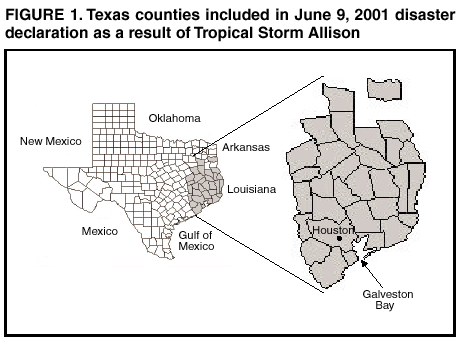
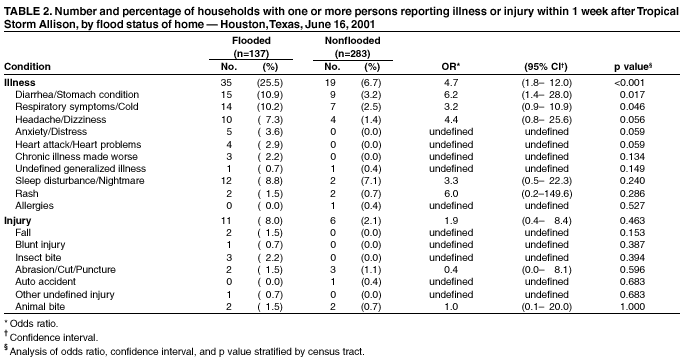
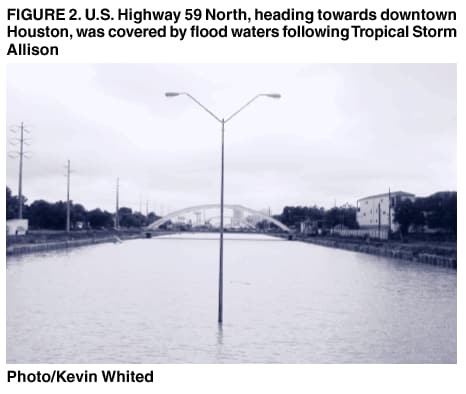
Persons using assistive technology might not be able to fully access information in this file. For assistance, please send e-mail to: mmwrq@cdc.gov. Type 508 Accommodation and the title of the report in the subject line of e-mail. Tropical Storm Allison Rapid Needs Assessment --- Houston, Texas, June 2001On June 5, 2001, Tropical Storm Allison made landfall on Galveston Island, Texas. During the next 2 days, the system soaked much of southeast Texas and south-central Louisiana with more than 10 inches of rain as it moved slowly northward. On June 7, the storm made a clockwise loop back to the southwest, bringing even more rain to already drenched areas. The record rainfall caused billions of dollars in flood-related damage and approximately 25 deaths and led to a presidential disaster declaration covering 31 Texas counties (Figure 1) and 28 Louisiana parishes. Harris County, Texas (2000 population: 3,400,578), center of the Houston metropolitan area, was among the hardest hit with some areas receiving up to 37 inches of rain in 24 hours (1) (Figure 2). To evaluate the community's immediate public health needs, the City of Houston Department of Health and Human Services (HDHHS) conducted a rapid needs assessment in the areas most affected by flooding. This report summarizes assessment results, which identified increased illness in persons living in flooded homes, suggesting a need for rapid resolution of flood-related damage and the possibility that residents should seek temporary housing during clean-up and repair. The findings underscore the usefulness of rapid needs assessment as a tool to minimize misinformation, identify actual health threats, and ensure delivery of resources to those with the greatest and most immediate need. Severely flood-affected areas of Houston, identified by the City of Houston Office of Emergency Management, were divided into two sectors: Area A, in the northeast section of the city, comprised 96 census tracts, 148,654 housing units, and 443,356 residents; and Area B, covering the western part of the city, comprised 72 census tracts, 167,158 housing units, and 400,868 residents. Using modified cluster sampling (2,3), HDHHS obtained a random sample of 30 census tracts from each of the two areas by using statistical software (SPSS V.10). One neighborhood from each of these 60 tracts was selected by delineating block groups using 1997 household estimates (housing unit data from the 2000 census were not yet available), breaking into quintiles the distribution of household population, and selecting the block group with the highest population and concentration of streets. A standardized questionnaire was developed to collect information about demographics, extent of home damage, number of residents forced to leave their homes, reported illnesses and injuries among household members, disruption of public services, and current needs. The goal was to obtain completed questionnaires from seven households in each of the 60 selected census tracts for a total sample of 420 households. Data were analyzed by using SAS for Windows (release 8.01). Data were stratified by census tract for calculation of illness and injury odds ratios for living in a flooded versus nonflooded home. HDHHS conducted the survey door to door on June 16, 2001, 1 week after the heaviest rainfall caused the worst flooding, and met its goal of 420 completed questionnaires (Table 1). The overall response rate was 59.3%; nonresponses included 257 instances of no one at home, 20 refusals, seven uninhabited households, and four households in which a language barrier prevented communication. Of the 420 households surveyed, 389 (92.6%) were single-family homes, and mean household size was 3.3 persons (range: 0--20 persons). A total of 137 (32.6%) surveyed households had floodwaters in the home; mean floodwater depth was 16 inches (median: 12 inches, range: 1--60 inches), and mean duration floodwaters remained in the home was 36.8 hours (median: 24 hours, range: 1--168 hours). A total of 149 (35.5%) surveyed households reported damage to the home; all but one of these were either habitable (116 [77.9%]) or repairable (32 [21.5%]). Survey participants in 57 (13.6%) households reported spending at least 1 night away from home. For some period during or after the flooding, 138 (32.9%) households reported interruption in telephone service, 63 (15.0%) had no sewage service, 61 (14.5%) lost electricity, 44 (10.5%) lost natural gas supply, and 23 (5.5%) had no running water. At the time of the survey, some households were still without telephone service (38 [9.0%]), natural gas (29 [6.9%]), sewage service (21 [5.0%]), electricity (eight [1.9%]), or running water (eight [1.9%]). The most commonly identified needs were mosquito control, pharmacy access, and new household furnishings. Other needs included medical access, shelter, food, home repair, clothing, transportation, drainage assistance, financial assistance, and heavy trash pick-up. Fifty-four (12.9%) surveyed households reported at least one person with illness that occurred after the onset of flooding. Persons living in flooded homes were significantly more likely than those living in nonflooded homes to report illness; the only specific illness significantly associated with residing in a flooded home was diarrhea/stomach conditions (Table 2). A total of 17 (4.0%) surveyed households reported at least one person injured after the onset of flooding. No significant association existed between likelihood of reporting an injury and living in a flooded home compared with a nonflooded home, nor were any specific injuries so associated. Reported by: SC Waring, PhD, Univ of Texas Health Science Center School of Public Health; M desVignes-Kendrick, MD, RR Arafat, MD, KM Reynolds, MPH, G D'Souza, MS, SA Bishop, MS, City of Houston Dept of Health and Human Svcs, Houston; DM Perrotta, PhD, Texas Dept of Health. M Cruz, MPH, Emergency and Environmental Health Svcs; D Batts-Osborne, MD, Div of Environmental Hazards and Health Effects, National Center for Environmental Health; BS Winterton, DVM, EIS Officer, CDC. Editorial Note:Flooding is the most common type of natural disaster worldwide, and flash flooding, often associated with the heavy, localized rainfall that occurs in a tropical storm, is the leading cause of weather-related deaths in the United States (4). Public health impacts of flooding include damage to homes and consequent displacement of occupants, infectious disease morbidity exacerbated by crowded living conditions and compromised personal hygiene, contamination of water sources, disruption of sewage service and solid-waste collection, increased vector populations, injuries sustained during clean-up, stress-related mental health and substance-abuse problems, and death (5--7). The finding of increased illness prevalence is consistent with previous reports of flood-related morbidity (5,8); this report shows the increase as significantly associated with residing in a flooded versus a nonflooded home. Conversely, recovery-period surveillance conducted at selected emergency departments, shelters, and contingency clinics immediately after the onset of flooding detected neither outbreaks of specific diseases nor unusual incidence of injuries or gastrointestinal or respiratory disease (HDHHS, unpublished data, 2001). Although these contradictory findings might be attributed to difficulties associated with collecting adequate surveillance information from clinics and shelters during the immediate post-disaster response, they also might represent potential limitations of the rapid needs assessment approach. Differences might exist between the nature of illnesses and injuries reported by clinic-based surveillance conducted immediately post-disaster and those self-reported through a survey a week later. Furthermore, persons not at home and therefore unable to participate in the needs assessment survey might have been away from home because of illness or injury. In addition to the potential for actual flood-related health impacts, rumors of epidemics often follow floods and other natural disasters and quickly gain public credibility when reported by the media (5,9,10). Actual threats and the potential for rumors combine to underscore the need for rapid information gathering to facilitate decision making and address public concerns. Rapid needs assessment---combining epidemiologic, anthropologic, and statistical methods---provides accurate information quickly and at low cost to minimize misinformation and identify actual health threats (2). This assessment was planned, conducted, and analyzed within 1 week and quickly provided important information to the City of Houston Mayor's Office, City Council members, City of Houston Office of Emergency Management, American Red Cross, Federal Emergency Management Agency, CDC's Emergency Response team, Texas Department of Health, and other agencies assisting with flood recovery efforts. These findings underscore the usefulness of rapid needs assessment as a practical and responsive data-gathering tool to complement clinic-based surveillance in disaster settings. The results were integral in assessing damage, setting priorities for service delivery, and directing assistance efforts. Numerous persons with special needs were identified and the appropriate assistance agencies quickly notified, heavy trash pick-up crews were redirected to neighborhoods where they were needed most, and residents of an area with chronic drainage problems were put in contact with the city engineering department to work out plans for future improvements. The results of this assessment will guide future needs assessments, disaster-response planning, and disaster-effects mitigation. References
|
Use of trade names and commercial sources is for identification only and does not imply endorsement by the U.S. Department of
Health and Human Services. |
Disclaimer All MMWR HTML versions of articles are electronic conversions from ASCII text into HTML. This conversion may have resulted in character translation or format errors in the HTML version. Users should not rely on this HTML document, but are referred to the electronic PDF version and/or the original MMWR paper copy for the official text, figures, and tables. An original paper copy of this issue can be obtained from the Superintendent of Documents, U.S. Government Printing Office (GPO), Washington, DC 20402-9371; telephone: (202) 512-1800. Contact GPO for current prices.
**Questions or messages regarding errors in formatting should be addressed to mmwrq@cdc.gov.Page converted: 5/2/2002
|
|
|||||
|
HOME |
ABOUT MMWR |
MMWR SEARCH |
DOWNLOADS |
RSS
|
CONTACT
|
|||||
|
|
|||||
|
This page last reviewed 5/2/2002