|
|
|
|
|
|
|
| ||||||||||
|
|
|
|
|
|
|
||||
| ||||||||||
|
|
|
|
|
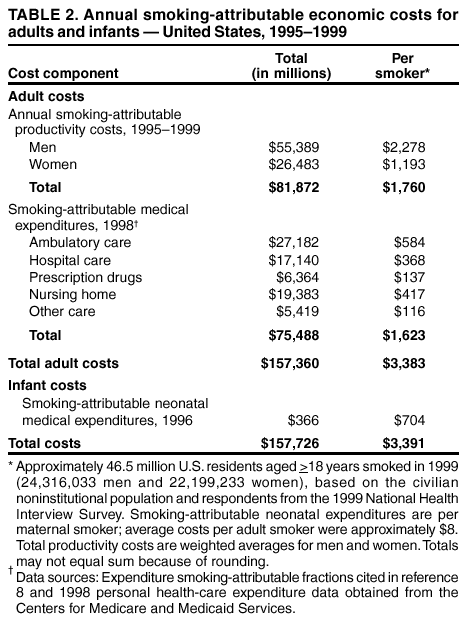
Persons using assistive technology might not be able to fully access information in this file. For assistance, please send e-mail to: mmwrq@cdc.gov. Type 508 Accommodation and the title of the report in the subject line of e-mail. Annual Smoking-Attributable Mortality, Years of Potential Life Lost, and Economic Costs --- United States, 1995--1999Cigarette smoking is the leading cause of preventable death in the United States and produces substantial health-related economic costs to society (1,2). This report presents the annual estimates of the disease impact of smoking in the United States during 1995--1999. CDC calculated national estimates of annual smoking-attributable mortality (SAM), years of potential life lost (YPLL), smoking-attributable medical expenditures (SAEs) for adults and infants, and productivity costs for adults. Results show that during 1995--1999, smoking caused approximately 440,000 premature deaths in the United States annually and approximately $157 billion in annual health-related economic losses. Implementation of comprehensive tobacco-control programs as recommended by CDC (3) could effectively reduce the prevalence, disease impact, and economic costs of smoking. The disease impact of smoking was estimated by using the Adult and Maternal and Child Health Smoking-Attributable Mortality, Morbidity, and Economic Costs (SAMMEC) software (4). Smoking-attributable deaths were calculated by multiplying estimates of the smoking-attributable fraction (SAF) of preventable deaths by total mortality data for 18 adult and four infant causes of death. For adults, SAFs were derived by using relative risks (RRs) for each cause of death from the American Cancer Society's Cancer Prevention Study-II (CPS-II;1982--1988) (5) and current and former cigarette smoking prevalence for two age cohorts: persons aged 35--64 years and persons aged >65 years (4).* For infants, SAFs were calculated by using RRs of death for infants of women who smoked during pregnancy and maternal smoking rates from birth certificates for 46 states, the District of Columbia, and New York City (birth certificate data for 1995--1999 were not available for California, Indiana, South Dakota, and the remainder of New York) (4). Smoking-attributable YPLL and productivity costs were estimated by multiplying age- and sex-specific SAM by remaining life expectancy and lifetime earnings data, respectively. Smoking-attributable fire deaths (6) were included in the SAM and YPLL estimates; SAM included lung cancer and heart disease deaths attributable to exposure to secondhand smoke (7). Annual medical costs of smoking for adults aged >18 years were estimated by multiplying 1998 personal health-care expenditure data from the Centers for Medicare and Medicaid Services by medical expenditure SAFs for ambulatory, hospital, prescription drugs, nursing home, and other personal health care (8). Expenditure SAFs represent the proportions of personal health-care expenditures that could be avoided by eliminating smoking. These SAFs were derived from econometric analyses of national medical expenditure survey data that included information on a person's smoking history, other risk behaviors, socioeconomic status, and demographic characteristics. Nursing home SAFs were based on estimates of the impact of smoking on the probability of admission to a nursing home; multiple admissions and length of stay in the nursing home were not considered. Neonatal medical costs of smoking in 1996 were calculated by using maternal smoking prevalence and health-care use data from the 1995 Pregnancy Risk Assessment Monitoring System (PRAMS) (4). Neonatal SAFs and SAEs were derived by applying 1996 private insurance-based costs (obtained from Medstat Group, Inc.) per night to smoking-attributable nights in hospitals and neonatal intensive-care units (4). During 1995--1999, smoking caused an annual average of 264,087 deaths among men and 178,311 deaths among women in the United States (Table 1). Among adults, most smoking-related deaths were attributed to lung cancer (124,813), ischemic heart disease (81,976), and chronic airways obstruction (64,735). Smoking during pregnancy resulted in the death of 599 male and 408 female infants annually. Total annual SAM estimates include the deaths of 589 males and 377 females by residential fire during 1994--1998 (5), and the deaths of 15,517 males and 22,536 females from lung cancer and heart disease attributable to exposure to secondhand smoke (6). For men, the average number of annual smoking-attributable cancer deaths during 1995--1999 decreased by approximately 1,100 (to 102,812 deaths) from 1990--1994; the number of cardiovascular disease deaths fell by approximately 28,000 (to 90,906 deaths), and the number of respiratory disease deaths remained stable (53,713 deaths). For women, the average number of annual smoking-attributable cancer deaths during 1995--1999 increased by approximately 5,800 (to 54,664 deaths), the number of respiratory disease deaths increased by approximately 7,300 (to 44,429 deaths), and the number of cardiovascular disease deaths fell by approximately 5,400 (to 57,699 deaths). Compared with 1990--1994, during 1995--1999, the average number of annual smoking-attributable deaths from perinatal conditions fell from 926 to 598 for males and from 666 to 407 for females. Excluding adult deaths from secondhand smoke, each year SAM was responsible for an estimated 3,332,272 YPLL for men and 2,284,113 for women. Adult male and female smokers lost an average of 13.2 and 14.5 years of life, respectively, because they smoked. During 1995--1999, the average annual mortality-related productivity losses attributable to smoking for adults were $81.9 billion (Table 2). In 1998, smoking-attributable personal health-care medical expenditures were $75.5 billion. For each of the approximately 46.5 million adult smokers in 1999, these costs represent $1,760 in lost productivity and $1,623 in excess medical expenditures. Smoking-attributable neonatal expenditures were $366 million in 1996, or $704 per maternal smoker ($8 per adult smoker). Maternal smoking accounted for 2.3% of total neonatal medical expenditures in 1996. The economic costs of smoking totaled $3,391 per smoker per year. Reported by: JL Fellows, PhD, A Trosclair, MS, Office on Smoking and Health, EK Adams, PhD, CC Rivera, Div of Reproductive Health, National Center for Chronic Disease Prevention and Health Promotion, CDC. Editorial Note:During 1995--1999, a total of 442,398 persons in the United States died prematurely each year as a result of smoking. This number, which is higher than previous SAM estimates (1), reflects the inclusion of 35,053 secondhand smoking-attributable heart disease deaths and slightly higher smoking-related RRs for cancers, respiratory diseases, and infant conditions. The number of smoking-attributable deaths would have been greater if smoking prevalence among men, women, and pregnant women had not declined since the early 1990s. Reported annual medical and productivity losses are larger than previous estimates of $53 billion (7) and $43 billion (2), respectively. Among adults, the medical costs of smoking represented approximately 8% of personal health-care expenditures in 1998, which is consistent with the 6%--14% SAFs in previous studies (2). The larger productivity-loss figure reflects increases in the number of smoking-attributable deaths and in average earnings since the mid-1980s. The findings in this report are subject to at least five limitations. First, the reported SAM figures were derived from smoking rates in the current year, whereas actual smoking-attributable deaths were the result of smoking in previous decades, when smoking rates were higher. Second, RRs were adjusted for the effects of age but not for other potential confounders. However, CPS-II data showed that education, alcohol, and other confounders had negligible additional impact on SAM estimates for lung cancer, chronic obstructive pulmonary disease, ischemic health disease, and cerebrovascular disease (1). Third, deaths attributable to cigar smoking, pipe smoking, and smokeless tobacco use were not included. Fourth, productivity losses did not include the value of lost work time from smoking-related disability, absenteeism, excess work breaks, and secondhand smoke-related disease morbidity and mortality. Finally, the neonatal medical costs of maternal smoking understate the probable true costs of smoking-attributable conditions among children because the future medical costs for infants affected by maternal smoking and the current costs of treating newly diagnosed secondhand smoke-related conditions among children aged 1--4 years were not included. Cigarette smoking continues to be the principal cause of premature death in the United States and imposes substantial costs on society. For each of the approximately 22 billion packs sold in the U.S. in 1999, $3.45 was spent on medical care attributable to smoking, and $3.73 in productivity losses were incurred, for a total cost of $7.18 per pack. These costs provide a strong rationale for increasing funding for comprehensive tobacco-use interventions to the levels recommended by CDC. In California, decreases in smoking prevalence have resulted in reduced lung cancer and heart disease death rates (9,10). These results offer evidence of the potential benefits of expanding comprehensive tobacco-control programs in an effort to reduce current smoking prevalence by 50% by 2010. References
* SAFs for each disease are calculated by using the following equation: SAF= [(p0 + p1(RR1) + p2(RR2)) - 1] / [p0 + p1(RR1) + p2(RR2)] where p0=percentage of never smokers (persons who have never smoked >100 cigarettes), p1=percentage of current smokers (persons who have smoked >100 cigarettes and now smoke every day or some days), p2=percentage of former smokers (persons who have smoked >100 cigarettes and do not currently smoke), RR1=relative risk for current smokers relative to never smokers, and RR2=relative risk for former smokers relative to never smokers.
|
Use of trade names and commercial sources is for identification only and does not imply endorsement by the U.S. Department of
Health and Human Services. |
Disclaimer All MMWR HTML versions of articles are electronic conversions from ASCII text into HTML. This conversion may have resulted in character translation or format errors in the HTML version. Users should not rely on this HTML document, but are referred to the electronic PDF version and/or the original MMWR paper copy for the official text, figures, and tables. An original paper copy of this issue can be obtained from the Superintendent of Documents, U.S. Government Printing Office (GPO), Washington, DC 20402-9371; telephone: (202) 512-1800. Contact GPO for current prices.
**Questions or messages regarding errors in formatting should be addressed to mmwrq@cdc.gov.Page converted: 4/11/2002
|
|
|||||
|
HOME |
ABOUT MMWR |
MMWR SEARCH |
DOWNLOADS |
RSS
|
CONTACT
|
|||||
|
|
|||||
|
This page last reviewed 4/11/2002