|
|
|
|
|
|
|
| ||||||||||
|
|
|
|
|
|
|
||||
| ||||||||||
|
|
|
|
|
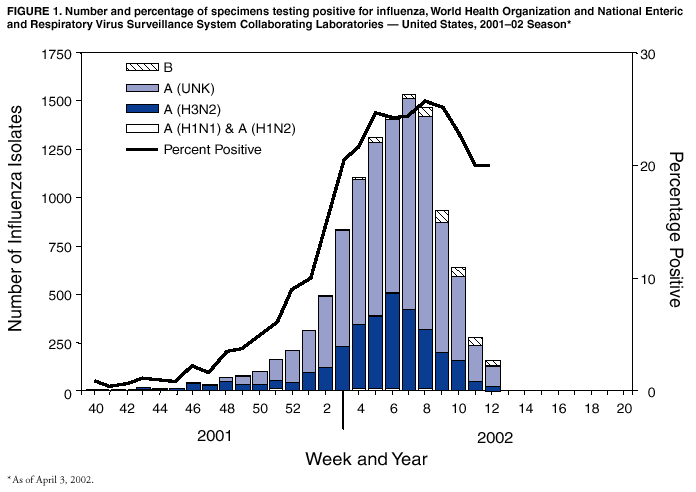
Persons using assistive technology might not be able to fully access information in this file. For assistance, please send e-mail to: mmwrq@cdc.gov. Type 508 Accommodation and the title of the report in the subject line of e-mail. Update: Influenza Activity --- United States, 2001--02 SeasonAlthough data collected from the four components of the CDC influenza surveillance system* are preliminary, national influenza activity appears to have peaked during the week ending February 23, 2002 (week 8). During the 2000--01 and 1999--2000 influenza seasons, peak activity occurred during week 4 and week 51, respectively. The viruses most commonly isolated during the 2001--02 season have been influenza A (H3N2). These viruses were well-matched antigenically by the 2001--02 influenza A (H3N2) strain in the vaccine. This report summarizes influenza activity in the United States† during September 30, 2001--March 23, 2002, and updates previous summaries from this season (1,2). For the weeks ending January 26 (week 4) through March 23 (week 12), the period covered since the last report, the percentage of respiratory specimens testing positive for influenza viruses, a key indicator of the level of influenza activity, ranged from 17.6% (week 4) to 25.9% (week 8) (Figure 1). Since September 30, 2001, World Health Organization (WHO) and National Respiratory and Enteric Virus Surveillance System (NREVSS) collaborating laboratories in the United States tested 72,877 specimens for influenza viruses; 12,017 (16.5%) were positive, of which 11,599 (97%) were influenza A viruses and 418 (3%) were influenza B viruses. Approximately one third of the influenza B viruses were isolated in the Mid-Atlantic region of the United States. Of the 3,479 influenza A viruses that have been subtyped, 3,426 (98%) were H3 viruses, and 53 (2%) were H1 viruses. CDC has characterized antigenically 391 influenza isolates collected in the United States since September 30. Of these, 279 were influenza A (H3N2) viruses, 14 were influenza A (H1) viruses, and 96 were influenza B viruses. Of the 14 A (H1) viruses, five were A (H1N1) viruses and nine were A (H1N2) viruses. These nine A (H1N2) viruses came from patient specimens collected in Wisconsin in December 2001. Two other A (H1N2) viruses were isolated from patient specimens collected during July and September in Texas and Nevada, respectively. The influenza A (H3N2) and A (H1) viruses were similar antigenically to the vaccine strains A/Panama/2007/99 (H3N2) and A/New Caledonia/20/99 (H1N1) viruses, respectively. Influenza B viruses currently circulating worldwide can be divided into two antigenically distinct lineages: B/Yamagata/16/88 and B/Victoria/2/87. B/Yamagata viruses have circulated widely since 1990, and the B component of the current influenza vaccine belongs to this lineage. Since 1991, B/Victoria viruses had not been identified outside of Asia. However, since March 2001, B/Victoria lineage viruses have been identified in many countries, including the United States. Of the 96 U.S. influenza B viruses characterized antigenically this season, 53 were of the B/Yamagata lineage, and 43 were of the B/Victoria lineage. Of the 53 B/Yamagata lineage viruses, 22 were similar to the vaccine strain, B/Sichuan/379/99, and 31 demonstrated reduced titers to ferret antisera produced against B/Sichuan/379/99. During January 20--March 23, 2002, the weekly percentage of patient visits for influenza-like illness (ILI)§ reported by U.S. sentinel physicians in 47 states ranged from 1.7% to 3.5%. For the week ending March 23, the percentage of patient visits for ILI was 1.7%, below the national baseline of 1.9%¶. During the same week, influenza activity** reported by state epidemiologists was widespread in three states (Arizona, Missouri, and Vermont), and regional in 17 states (California, Idaho, Illinois, Louisiana, Michigan, Montana, Nebraska, New York, Ohio, South Carolina, South Dakota, Tennessee, Texas, Utah, Virginia, Washington, and Wisconsin). Twenty-seven states, New York City, and Washington, D.C. reported sporadic influenza activity, and Alaska and Georgia reported no influenza activity. One state did not report. During the week ending March 23, the 122 Cities Mortality Reporting System attributed 8.8% of recorded deaths to pneumonia and influenza (P&I). This percentage was above the epidemic threshold†† of 8.2% for that week. The percentage of P&I deaths was above the epidemic threshold during weeks 9 through 12. Reported by: WHO Collaborating Center for Surveillance, Epidemiology, and Control of Influenza; A Postema, MPH, L Brammer, MPH, H Hall, A Klimov, PhD, K Fukuda, MD, N Cox, PhD, Div of Viral and Rickettsial Diseases, National Center for Infectious Diseases; S Harper, MD, EIS Officer, CDC. Editorial Note:Influenza activity in the United States during the current season increased steadily during December--January, peaked in February, and is declining nationwide. Influenza activity has peaked during February or later during 15 of the last 25 seasons. Last season, influenza activity peaked in January. In recent weeks, influenza B virus activity has increased in certain areas of the country, and both influenza A and B viruses might continue to circulate during April. During 2001--2002, influenza A (H1N2) viruses have been isolated from several countries, including the United States (3). These new A (H1N2) viruses appear to have resulted from reassortment of the genes of currently circulating influenza A (H1N1) and A (H3N2) subtypes. Because hemagglutinin proteins of the A (H1N2) viruses are similar to those of the currently circulating A (H1N1) viruses, and the neuraminidase proteins are similar to those of the current A (H3N2) viruses, the current vaccine should provide good protection against the new A (H1N2) viruses (4). No information indicates that A (H1N2) viruses are causing more severe illness than other influenza A viruses, and no unusual increases in influenza activity have been associated with these viruses. Similar reassortment A (H1N2) viruses were isolated in China during the 1988--89 influenza season but had not been reported in other parts of the world since that time. Whether the new A (H1N2) viruses will persist is uncertain. The Food and Drug Administration's Vaccine and Related Biological Products Advisory Committee (VRBPAC) recommended inclusion of the A/New Caledonia/20/99-like (H1N1), A/Moscow/10/99-like (H3N2), and B/Hong Kong/330/2001-like viruses in the 2002--03 trivalent influenza vaccine for the United States (5). The A (H1N1) and A (H3N2) components are the same as those used in the 2001--02 season vaccine. The influenza B component of the 2002--03 season vaccine is new and will be a virus of the B/Victoria lineage. The emergence of B/Victoria lineage influenza viruses around the world led to the recommended change in the B strain to be included in the 2002--03 vaccine. The B component of the current influenza vaccine is expected to provide lower levels of protection against viruses of the B/Victoria lineage. CDC annually collects and reports U.S. influenza surveillance data during October--May. During this period, the information is updated weekly and is available through CDC voice information, 888-232-3228, fax information, 888-232-3299 (request document number 361100), or at http://www.cdc.gov/ncidod/diseases/flu/weekly.htm. AcknowledgmentThis report is based on data contributed by participating state and territorial epidemiologists and state health laboratories, WHO collaborating laboratories, National Respiratory and Enteric Virus Surveillance System laboratories, Sentinel Physicians Influenza Surveillance System, Div of Public Health Surveillance and Informatics, Epidemiology Program Office, Div of Vital Statistics, CDC. References
*WHO and NREVSS collaborating laboratories, national sentinel physician influenza-like illness tracking system, 122 Cities Mortality Reporting System, and state and local health department reporting. †As of April 3, 2002. § Temperature of >100.0ºF (>37.8ºC) and either cough or sore throat in the absence of a known cause. ¶ The national baseline was calculated as the mean percentage of visits for ILI during noninfluenza weeks plus two standard deviations. Because of wide variability in regional level data, calculating region-specific baselines is not possible, and to apply the national baseline to regional level data is not appropriate. ** Levels of activity: 1) no activity, 2) sporadic---sporadically occurring ILI or laboratory-confirmed influenza with no outbreaks detected, 3) regional---outbreaks of ILI or laboratory-confirmed influenza in counties with a combined population of <50% of the state's population, and 4) widespread---outbreaks of ILI or laboratory-confirmed influenza in counties with a combined population of >50% of the state's population. †† The expected baseline proportion of P&I deaths reported by the 122 Cities Mortality Reporting System is projected by using a robust regression procedure in which a periodic regression model is applied to the observed percentage of deaths from P&I since 1983. The epidemic threshold is 1.654 standard deviations above the seasonal baseline. Before the 1999--2000 season, a new case definition for a P&I death was introduced. During summer 2000, the baseline and epidemic thresholds were adjusted manually to account for these changes in case definition. For the 2001--02 season, sufficient data have been collected by using the new case definition to allow projection of the baseline using the regression procedure employed before the 2000--01 season.
|
Use of trade names and commercial sources is for identification only and does not imply endorsement by the U.S. Department of
Health and Human Services. |
Disclaimer All MMWR HTML versions of articles are electronic conversions from ASCII text into HTML. This conversion may have resulted in character translation or format errors in the HTML version. Users should not rely on this HTML document, but are referred to the electronic PDF version and/or the original MMWR paper copy for the official text, figures, and tables. An original paper copy of this issue can be obtained from the Superintendent of Documents, U.S. Government Printing Office (GPO), Washington, DC 20402-9371; telephone: (202) 512-1800. Contact GPO for current prices.
**Questions or messages regarding errors in formatting should be addressed to mmwrq@cdc.gov.Page converted: 4/4/2002
|
|
|||||
|
HOME |
ABOUT MMWR |
MMWR SEARCH |
DOWNLOADS |
RSS
|
CONTACT
|
|||||
|
|
|||||
|
This page last reviewed 4/4/2002