 |
|
|
|
|
|
|
| ||||||||||
|
|
|
|
|
|
|
||||
| ||||||||||
|
|
|
|
|
Persons using assistive technology might not be able to fully access information in this file. For assistance, please send e-mail to: mmwrq@cdc.gov. Type 508 Accommodation and the title of the report in the subject line of e-mail. Cigarette Smoking in 99 Metropolitan Areas --- United States, 2000Geographic variation in the prevalence of cigarette smoking contributes to differences in the mortality patterns of smoking-related diseases such as lung cancer, chronic obstructive lung disease, and coronary heart disease (1). National and state-specific data on cigarette smoking are available but may be limited in their usefulness in guiding local or county smoking-related health interventions. CDC's Behavioral Risk Factor Surveillance System (BRFSS) is an annual, state-based survey that includes questions about tobacco use and has sufficiently large samples to permit analyses of risk factor data for many metropolitan statistical areas (MSAs). This report summarizes estimates of smoking behavior for the 99 MSAs with >300 respondents (maximum: 7,264) in the 2000 BRFSS. The prevalence of smoking among the 99 MSAs ranged from 13.0% to 31.2% (median: 22.7%), and the percentage of daily smokers who quit for >1 day ranged from 33.0% to 62.2% (median: 50.3%). The findings in this report indicate that BRFSS can provide baseline data for monitoring local programs and a benchmark for comparing data from local surveys. In 2000, BRFSS was conducted in 50 states, the District of Columbia, and Puerto Rico; randomly selected noninstitutionalized persons aged >18 years were interviewed by telephone. The median response rate was 53.2% (range: 35.5%--77.7%) (2). BRFSS response rates for MSAs are not available. Estimates are poststratified by age and sex and for some states by race/ethnicity to adjust for nonresponses. MSAs were identified using the standard definitions from the U.S. Bureau of the Census (3). In the 2000 BRFSS, respondents were asked, "Have you smoked at least 100 cigarettes in your entire life?" and "Do you now smoke cigarettes every day, some days, or not at all?" Current smokers were persons who reported having smoked >100 cigarettes during their lifetimes and who currently smoked every day or some days. Respondents who smoked every day were asked, "During the past 12 months, have you quit smoking for a day or longer?" Data were weighted to each MSA based on age, sex, and race/ethnicity; 95% confidence intervals for point estimates were calculated using SUDAAN. Statistical significance was determined on the basis of nonoverlapping confidence intervals. The median adult prevalence of current smoking for the 99 MSAs was 22.7% (range: 13.0%--31.2%) (Table 1). The five MSAs with the highest prevalence of current smoking (Toledo, Ohio; Knoxville, Tennessee; Indianapolis, Indiana; Cleveland-Lorain-Elyria, Ohio; and Huntington-Ashland, West Virginia) differed significantly from the five MSAs with the lowest prevalence (Orange County, California; Salt Lake City-Ogden, Utah; San Diego, California; Miami, Florida; Bergen-Passaic, New Jersey; and Las Cruces, New Mexico) (Table 1). By region, median prevalence was highest in the Midwest (23.7%), followed by the South (23.2%), Northeast (20.8%), and West (20.6%). Prevalence was higher for men than women in 73 of 99 MSAs; the difference by sex was significant in six (Los Angeles, California; Honolulu, Hawaii; Wichita, Kansas; New Orleans, Louisiana; Charlotte, North Carolina; and Dallas, Texas). Among daily smokers, the median percentage that had quit for >1 day during the 12 months preceding the survey was 50.3% (range: 33.0%--62.2%). The two MSAs with the lowest percentage (Charleston, West Virginia, and Toledo, Ohio) differed significantly from the two MSAs with the highest percentage (Fort Worth-Arlington, Texas, and Detroit, Michigan). The percentage was highest in the West (52.1%) followed by the Northeast (51.5%), South (50.4%), and Midwest (49.1%). Reported by: D Nelson, S Marcus, National Cancer Institute, Bethesda, Maryland. H Wells, G Laird, J Dever, Research Triangle Institute, North Carolina. The following BRFSS coordinators: S Reese, Alabama; P Owen, Alaska; R Weyant, Arizona; B Woodson, Arkansas; B Davis, California; D Brand, Colorado; M Adams, Connecticut; F Breukelman, Delaware; J Davies-Cole, District of Columbia; S Oba, Florida; L Martin, Georgia; F Reyes-Salvail, Hawaii; J Aydelotte, Idaho; B Steiner, Illinois; L Stemnock, Indiana; D Shepard, Iowa; CM Arnold, Kansas; T Sparks, Kentucky; B Bates, Louisiana; J Graber, Maine; H Lopez, Maryland; Z Zhang, Massachusetts; H McGee, Michigan; N Salem, Minnesota; D Johnson, Mississippi; J Jackson, Missouri; P Feigley, Montana; L Andelt, Nebraska; E DeJan, Nevada; J Porter, New Hampshire; G Boeselager, New Jersey; W Honey, New Mexico; C Baker, New York; Z Gizlice, North Carolina; L Shireley, North Dakota; P Coss, Ohio; K Baker, Oklahoma; K Pickle, Oregon; L Mann, Pennsylvania; Y Cintron, Puerto Rico; J Hesser, Rhode Island; M Wu, South Carolina; M Gildemaster, South Dakota; D Ridings, Tennessee; K Condon, Texas; K Marti, Utah; R McCormick, Vermont; G Seifen, Virginia; K Wynkoop-Simmons, Washington; F King, West Virginia; K Pearson, Wisconsin; M Futa, Wyoming. Behavioral Surveillance Br, Div of Adult and Community Health; and Office on Smoking and Health, National Center for Chronic Disease Prevention and Health Promotion, CDC. Editorial Note:This is the first report using consistent methodology to examine variations in smoking prevalence across U.S. MSAs. The findings demonstrated an approximately twofold difference, with the lowest prevalence for MSAs in California and Utah and the highest for MSAs in Ohio, Indiana, and Tennessee. Only three (Orange County and San Diego, California, and Salt Lake City, Utah) of the 99 MSAs met the national health objective for 2000 of <15% for prevalence of current smoking (objective 3.4) (4). The proportion of smokers who quit for >1 day also varied substantially across communities and was highest in the West and lowest in the Midwest. The proportion of smokers who quit for >1 day during the 12 months preceding the survey is an indicator of success in cessation initiatives and may reflect implementation of programs or policies at the individual, health-care provider, or community level (e.g., although clean indoor air policies are in place nationwide, their implementation varies substantially across the country and may account for some of the variation observed) (5). The findings in this report are subject to at least five limitations. First, although the median response was relatively low, BRFSS estimates are similar to estimates from other surveys with higher response rates such as the National Health Interview Survey (NHIS) (6). Nationwide smoking estimates from BRFSS and NHIS for 1997 were 23.1% and 24.7%, respectively. BRFSS and NHIS estimates for smoking among population subgroups differed by 0.4% to 4.1% (E. Powell-Griner, Ph.D., CDC, personal communication, August 2001). Second, the data are self-reported. Third, institutionalized persons or persons residing in households without a telephone were not eligible for interviews. Fourth, the precision of estimates varied across MSAs because of different sample sizes. Finally, smoking estimates may differ markedly within an MSA (e.g., between inner cities and suburbs). To control the use of tobacco requires an approach that includes successful activities such as increases in the cigarette excise tax, mass media education, counteradvertising, comprehensive school-based programs, policies on clean indoor air, telephone quit lines, reducing out-of-pocket costs for cessation services and products, and increasing cessation interventions in the health-care setting (5,7). Many communities have instituted local tobacco-control programs that have reduced the availability of tobacco products, lowered exposure to environmental tobacco smoke, and increased cessation activities (5). In California, state-based programs with a strong community focus have contributed to reductions in tobacco-related mortality (8). The National Association of County and City Health Officials (NACCHO) has published Program and Funding Guidelines for Comprehensive Local Tobacco Prevention and Control Program (9). With funds from state tobacco programs, routine and consistent tracking of smoking prevalence within MSAs can provide the tools to assess the impact of tobacco-control activities. States and local areas should implement aggressive and comprehensive programs at the community level that follow the NACCHO guidelines and recommendations from the CDC Best Practices for Comprehensive Tobacco Control Programs (10), Reducing Tobacco Use: A Report of the Surgeon General (5), and The Guide to Community Preventive Services: Tobacco Use Prevention and Control (7). Effective local tobacco control will be essential for reaching the 2010 national adult smoking prevalence goal of <12%. References
Table 1 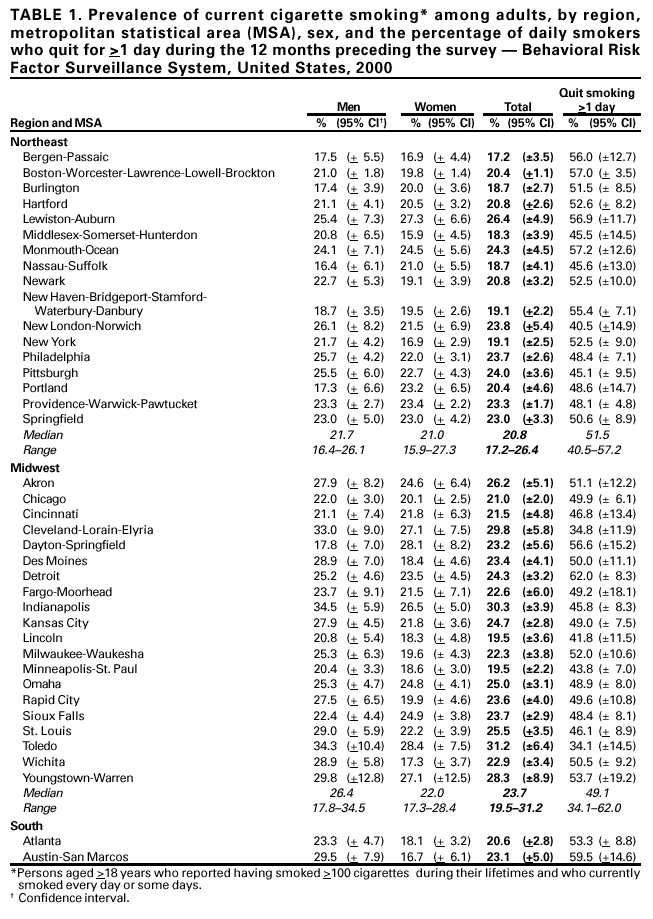 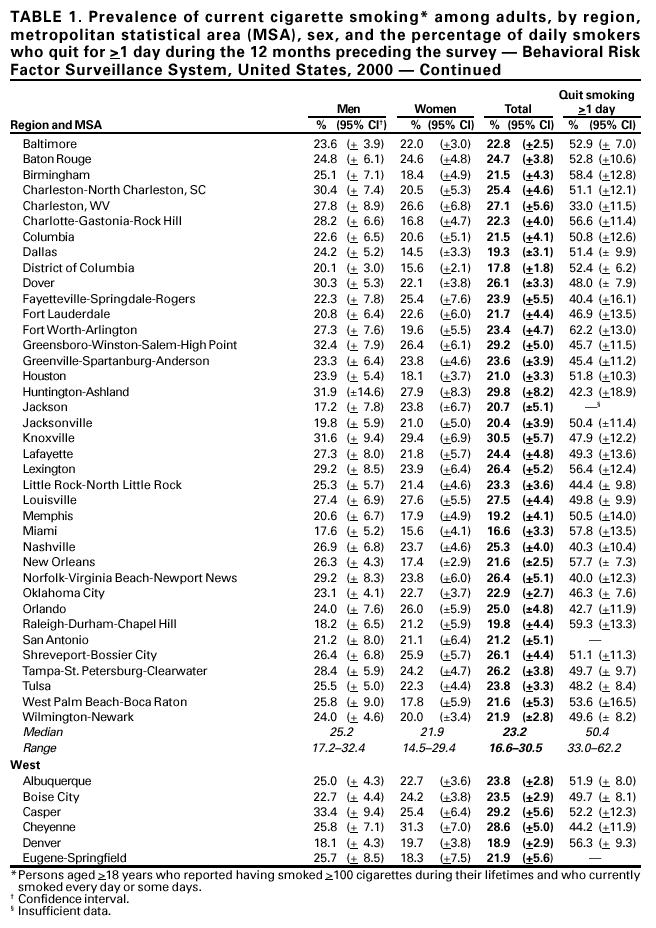 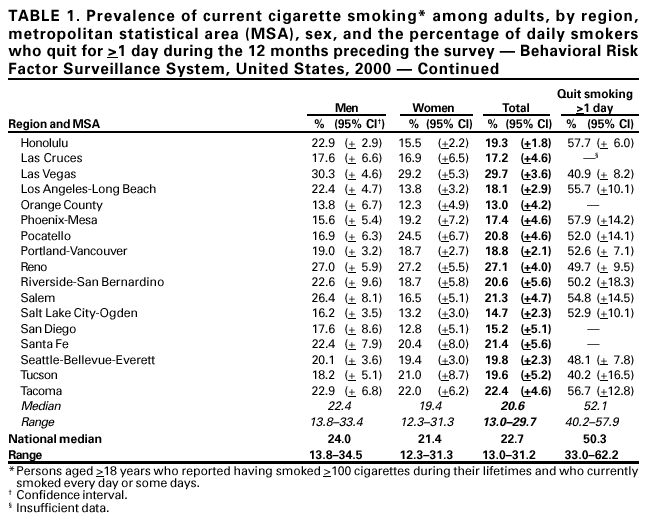 Return to top.
Disclaimer All MMWR HTML versions of articles are electronic conversions from ASCII text into HTML. This conversion may have resulted in character translation or format errors in the HTML version. Users should not rely on this HTML document, but are referred to the electronic PDF version and/or the original MMWR paper copy for the official text, figures, and tables. An original paper copy of this issue can be obtained from the Superintendent of Documents, U.S. Government Printing Office (GPO), Washington, DC 20402-9371; telephone: (202) 512-1800. Contact GPO for current prices. **Questions or messages regarding errors in formatting should be addressed to mmwrq@cdc.gov.Page converted: 12/13/2001 |
|||||||||
This page last reviewed 12/13/2001
|