 |
|
|
|
|
|
|
| ||||||||||
|
|
|
|
|
|
|
||||
| ||||||||||
|
|
|
|
|
Persons using assistive technology might not be able to fully access information in this file. For assistance, please send e-mail to: mmwrq@cdc.gov. Type 508 Accommodation and the title of the report in the subject line of e-mail. Cigarette Smoking among Adults --- United States, 1999Please note: An erratum has been published for this article. To view the erratum, please click here. One of the national health objectives for 2010 is to reduce the prevalence of cigarette smoking among adults from 24% in 1998 to <12% (objective 27.1a) (1). To assess progress toward this objective, CDC analyzed self-reported data from the 1999 National Health Interview Survey (NHIS) about cigarette smoking among U.S. adults. This report summarizes the findings of this analysis, which indicate that, in 1999, approximately 23.5% of adults were current smokers, representing a modest decline in prevalence since 1993. If states were to invest resources consistent with CDC recommendations and implement proven interventions, the decline in cigarette smoking could be accelerated. The 1999 NHIS adult core questionnaire was administered by personal interview to a nationally representative sample (n=30,801) of the U.S. noninstitutionalized civilian population aged >18 years; the overall response rate was 69.6%. Respondents were asked, "Have you smoked >100 cigarettes in your entire life?" and "Do you now smoke cigarettes every day, some days, or not at all?" Current smokers were persons who reported both having smoked >100 cigarettes during their lifetime and who smoked every day or some days. Former smokers were those who had smoked >100 cigarettes during their lifetime but currently did not smoke. Attempts to quit were determined by asking current smokers, "During the past 12 months, have you stopped smoking for 1 day or longer because you were trying to stop smoking?" Data were adjusted for nonresponses and weighted to provide national estimates. Confidence intervals (CIs) were calculated using SUDAAN. In 1999, an estimated 46.5 million adults (23.5% [95% CI=+0.6]) were current smokers. Overall, 19.2% (95% CI=+0.6) of adults were everyday smokers and 4.3% (95% CI=+0.3) were some day smokers. The prevalence of smoking was higher among men (25.7% [95% CI=+0.9]) than women (21.5% [95% CI=+0.7]) (Table 1). Among racial/ethnic groups, Hispanics (18.1% [95% CI=+1.3]) and Asians/Pacific Islanders (15.1% [95% CI=+3.1]) had the lowest prevalence of cigarette use; American Indians/Alaska Natives had the highest prevalence (40.8% [95% CI=+8.6]). Adults who had earned a General Educational Development diploma had the highest smoking prevalence (44.4% [95% CI=+4.5]); persons with masters, professional, and doctoral degrees had the lowest prevalence and met the 2010 objective (8.5% [95% CI=+1.3]). Prevalence was highest among persons aged 18--24 years (27.9% [CI=+1.9]) and 25--44 years (27.3% [CI=+1.0]) and lowest among those aged >65 years (10.6% [CI=+0.9]). The prevalence of smoking was highest among adults living below the poverty level* (33.1% [(95% CI=+2.0]) compared with those living at or above the poverty level (23.4% [95% CI=+0.7]), and lowest among those with unknown poverty status (20.2% [95% CI=+1.2]). In 1999, an estimated 45.7 million adults (23.1% [95% CI=+0.6]) were former smokers; 25.8 million were men and 19.9 million were women. Former smokers constituted 49.5% (95% CI=+1.0) of persons who had ever smoked >100 cigarettes. Among current smokers, an estimated 15.7 million (41.3% [95% CI=+1.5]) had stopped smoking at least 1 day during the preceding 12 months because they were trying to quit. During 1998--1999, significant changes in smoking prevalence (2) did not occur; however, since 1993, the prevalence of current smoking has slowly declined (Figure 1). To assess changes over time, 1993 data were compared with 1999 data† (3). Overall prevalence of current smoking declined significantly from 1993 (25.0% [95% CI=+0.7]) to 1999 (23.5% [95% CI=+0.6]). Data for 2000 (23.3% [95% CI=+0.6]) and preliminary data for January--March 2001 (22.3% [95% CI=+1.1]) suggest a continuing decline (4). During 1993--1999, no significant changes were observed in current smoking prevalence for any racial/ethnic group or for the population living below the poverty level; however, reductions were reported in adults with 12 years of education (from 29.2% [95% CI=+1.2] to 26.3% [95% CI=+1.1]), and in persons aged 45--64 years (from 26.0% [95% CI=+1.3] to 23.3% [95% CI=+1.0]). Prevalence of smoking among persons aged 18--24 years has not increased significantly; this age group continues to have the highest smoking prevalence (2). Reported by: Epidemiology Br, Office on Smoking and Health, National Center for Chronic Disease Prevention and Health Promotion, CDC. Editorial Note:After 4 years during which the prevalence of current smoking among U.S. adults remained unchanged (2), data from 1999 indicated a slow but significant decline; however, the 2010 objective of <12% for adult smoking prevalence will not be met unless the rate of decline increases significantly. The 2000 report of the Surgeon General (5) concluded that the 2010 objective could be met if comprehensive approaches to tobacco control were implemented fully. Increasing the unit price of tobacco products, smoking bans and restrictions, and mass media education campaigns for tobacco-use cessation are among the recommended measures (5,6) to increase quitting among a wide range of smokers. The decline in smoking prevalence that began in 1997 (Figure 1) may be explained, in part, by the December 1997--December 1999 increase in taxes and wholesale prices that resulted in a 49% price increase (7). The findings in this report are subject to at least two limitations. First, questionnaires and data collection procedures for NHIS have changed since 1993. In 1995, the sample was redesigned; in 1997, questions on tobacco use were moved from supplementary questionnaires to the adult core questionnaire. It is impossible to assess how these changes affected prevalence estimates and trend analysis or comparisons; therefore, statistical trend analysis from the years preceding 1997 should be approached with caution. Second, because the NHIS sample size of some racial/ethnic populations was small (e.g., American Indians/Alaska Natives), data for a single year might be unstable. Combining data from several years would produce more reliable estimates. Expanded access to treatment for nicotine dependence (e.g., FDA-approved pharmacotherapy and individual, group, and telephone counseling) will help more persons stop smoking. One method to increase access to treatment is to reduce out-of-pocket costs by covering therapies as a standard insurance benefit (1,5,7). Best Practices for Comprehensive Tobacco Control (8) recommends that cessation interventions be incorporated into comprehensive, statewide programs. Following the implementation of a comprehensive program, the Arizona Department of Health Services Tobacco Education and Prevention Program reported that prevalence among adult smokers decreased from 23.1% to 18.3% during 1996--1999, and the proportion of Arizona smokers who reported that a health-care provider had both asked them about their tobacco use and advised them to quit increased significantly during this period (9). To eliminate tobacco-related disease nationwide, comprehensive tobacco control programs similar to those in Arizona must focus on groups with high levels of smoking prevalence, including persons aged 18--24 years, with low incomes, with low education levels, and American Indians/Alaska Natives. Seven states (Arizona, Indiana, Maine, Massachusetts, Mississippi, Ohio, and Vermont) are funding tobacco prevention and control programs at the minimum level recommended by CDC (10). If all states invested resources consistent with these recommendations and spent resources on proven interventions, the decline in prevalence could be accelerated. References
*Poverty thresholds for 1998 from the Bureau of the Census, Economics and Statistics Administration, U.S. Department of Commerce. † The first year NHIS asked about some day smoking was 1991; refinements were made to the questions in 1992. Since 1993, the full sample of adults has been asked identical questions about some day smoking. Table 1 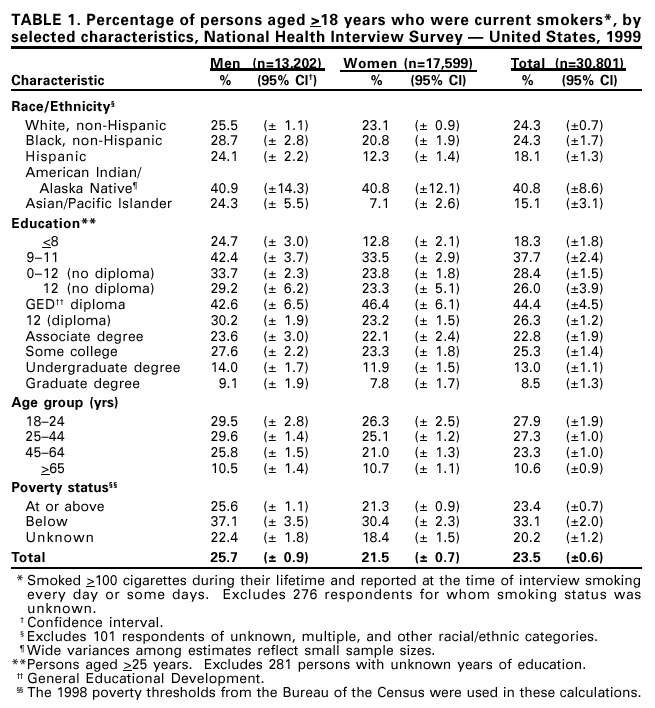 Return to top. Figure 1 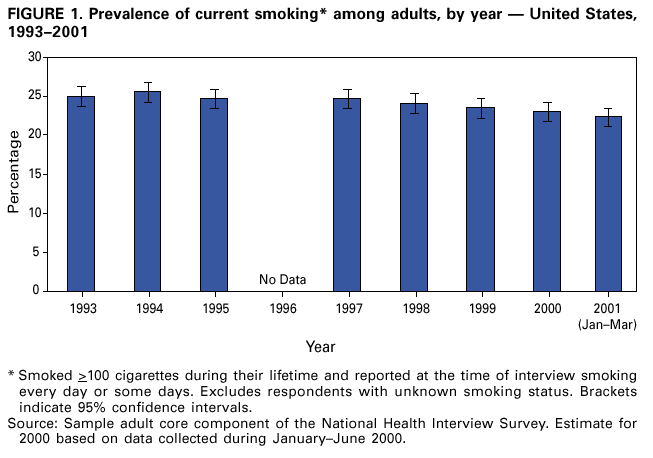 Return to top.
Disclaimer All MMWR HTML versions of articles are electronic conversions from ASCII text into HTML. This conversion may have resulted in character translation or format errors in the HTML version. Users should not rely on this HTML document, but are referred to the electronic PDF version and/or the original MMWR paper copy for the official text, figures, and tables. An original paper copy of this issue can be obtained from the Superintendent of Documents, U.S. Government Printing Office (GPO), Washington, DC 20402-9371; telephone: (202) 512-1800. Contact GPO for current prices. **Questions or messages regarding errors in formatting should be addressed to mmwrq@cdc.gov.Page converted: 10/12/2001 |
|||||||||
This page last reviewed 10/12/2001
|