 |
|
|
|
|
|
|
| ||||||||||
|
|
|
|
|
|
|
||||
| ||||||||||
|
|
|
|
|
Persons using assistive technology might not be able to fully access information in this file. For assistance, please send e-mail to: mmwrq@cdc.gov. Type 508 Accommodation and the title of the report in the subject line of e-mail. Declines in Lung Cancer Rates --- California, 1988--1997Cigarette smoking is the leading cause of lung and bronchus cancer (1). During 1988--1997, per capita cigarette smoking in California declined more than twice as rapidly compared with the rest of the country (2). To characterize lung cancer incidence in California, data from the National Cancer Institute's Surveillance, Epidemiology, and End Results (SEER) program were compared with data from the population-based California Cancer Registry (CCR). This report summarizes the results of that analysis, which indicated that during 1988--1997, age-adjusted lung cancer incidence rates in California declined significantly compared with stable incidence rates for the combined SEER area of five states and three metropolitan areas. SEER data used in the analysis were from Connecticut, Hawaii, Iowa, New Mexico, and Utah, and Atlanta, Georgia; Detroit, Michigan; and Seattle--Puget Sound, Washington (3). SEER registries in California were excluded from the SEER analysis and were included with the CCR data. CCR data were statewide; SEER data collected in California included Los Angeles and the San Francisco Bay area only. Data collection standards for SEER and CCR were similar. However, CCR had more data than the SEER California component; therefore, the combined CCR and SEER data provided a more reliable estimate of cancer rates than using the California SEER data alone. Cancer incidence rates were age-adjusted by the direct method based on estimated 2000 U.S. population data (3). Annual lung and bronchus cancer (International Classification of Diseases, for Oncology, codes C340--C349) incidence rates per 100,000 population during 1988--1997 were reported among men, women, and both sexes combined for California and the eight SEER regions combined (Table 1). Two measures of change were reported. First, the estimated annual percentage change (EAPC) was calculated using the average percentage increase or decrease in cancer incidence rates per year during 1988--1997, and a regression line was fitted using the assumption that the natural logarithm of cancer rates changed at a constant rate during the 10-year period. Second, the total percentage change was the average of 1988 and 1989 data minus the average of 1996 and 1997 data divided by 1988 and 1989 data and multiplied by 100. Statistical significance was set at alpha=0.01 (Figure 1). Non-California SEER data did not reveal a consistent pattern in the age-adjusted lung and bronchus cancer incidence rates during 1988--1997. EAPC of --0.4% per year was not significantly different from zero. Comparing the CCR incidence rates with non-California SEER incidence rates, the CCR lung and bronchus cancer incidence rates were slightly higher during 1988--1990 (Table 1). However, during 1991--1997, incidence rates in CCR declined from 68.0 per 100,000 to 60.1. During 1988--1997, overall lung and bronchus cancer CCR incidence rates decreased an average of 1.9% per year (p<0.01) (Figure 1). The CCR incidence rates decreased 14.0% during the 10-year period; the rates in non-California SEER regions decreased 2.7%. The decline in incidence rates among men (all ages combined) in the CCR data was 1.5 times greater than the decline among men in the non-California SEER regions. Among men, lung and bronchus cancer incidence rates declined significantly during 1988--1997 in data from the CCR and the SEER regions; however, the decline was greater in CCR (EAPC=--2.9%; p<0.01) compared with non-California SEER regions (EAPC=--1.8%; p<0.01). Among women (all ages combined) in CCR, lung and bronchus cancer incidence rates declined 4.8% during 1988--1997 (EAPC=--0.6; p<0.01); incidence rates among women in non-California SEER regions increased 13.2% (EAPC=1.5; p<0.01). Reported by: DW Cowling, PhD, SL Kwong, MPH, R Schlag, MS, JC Lloyd, MA, DG Bal, MD, Tobacco Control Section and Cancer Surveillance Section, California Dept of Health Svcs. Office on Smoking and Health, National Center for Chronic Disease Prevention and Health Promotion, CDC. Editorial Note:More than 80% of lung and bronchus cancer is caused by cigarette smoking, and former smokers have about half the risk for dying from lung cancer than do current smokers (1). Compared with current smokers, the risk for lung and bronchus cancer among former smokers declines as the duration of abstinence lengthens, with risk reduction becoming evident within 5 years of cessation (1). Reductions in the smoking rate in a state could reduce lung and bronchus cancer rates within 5 years of the decline in smoking rates (1). The difference in the rate of decline in lung and bronchus cancer incidence rates between California and other U.S. regions may be related, in part, to the significant declines in smoking rates as a result of California tobacco control initiatives. The California Tobacco Control Program was created by Proposition 99 and was approved in 1988 (2). The program emphasized a comprehensive approach to tobacco control, prevention, and education and included strategies to change social norms related to tobacco use. The decrease in per capita cigarette consumption that began in 1990 has been attributed to the $0.25 increase in the excise tax in 1989 (2). During 1988--1996, California had a more rapid decline in per capita cigarette consumption compared with the rest of the country (2,4). This decline has been attributed primarily to a change in the social acceptability of smoking among California residents (2,4). However, smoking rates in California were declining more rapidly than the rest of the country since the late 1980s, before enactment of Proposition 99. The findings in this study are subject to at least three limitations. First, the SEER cancer incidence rates are based on data from selected geographic areas and may not represent incidence rates nationally; SEER data in this analysis represent 9.5% of the U.S. population (excluding California). Second, although a constant rate of change over the study period is the standard assumption when using EAPC, this assumption has not been tested (3). Third, although decreased population smoking rates in California are probably responsible for reduced rates of lung and bronchus cancer, a cause-and-effort relation cannot be determined through population-based assessments. Following the California model, aggressive and comprehensive tobacco-control programs have been implemented in other states, including Arizona, Florida, Maine, Massachusetts, and Oregon. Initial results from several states have shown substantial declines in per capita cigarette consumption and/or changes in the prevalence of adult or youth smoking rates (4--8). The results of this report suggest that a comprehensive tobacco prevention and education program also may reduce rates of lung and bronchus cancer. On the basis of results from state programs, CDC published Best Practices for Comprehensive Tobacco Control (9). This document, along with the release of Surgeon General's Report, Reducing Tobacco Use: A Report of the Surgeon General (10), provides guidance to states in establishing successful and sustainable tobacco control programs. References
Table 1 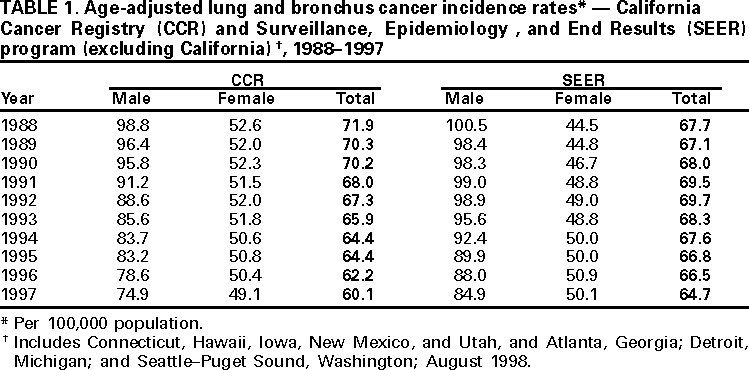 Return to top. Figure 1 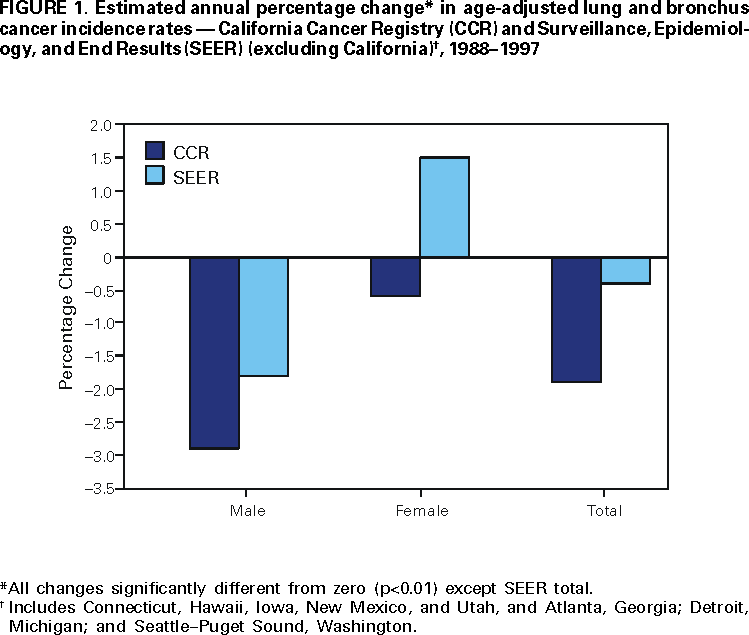 Return to top. Disclaimer All MMWR HTML versions of articles are electronic conversions from ASCII text into HTML. This conversion may have resulted in character translation or format errors in the HTML version. Users should not rely on this HTML document, but are referred to the electronic PDF version and/or the original MMWR paper copy for the official text, figures, and tables. An original paper copy of this issue can be obtained from the Superintendent of Documents, U.S. Government Printing Office (GPO), Washington, DC 20402-9371; telephone: (202) 512-1800. Contact GPO for current prices. **Questions or messages regarding errors in formatting should be addressed to mmwrq@cdc.gov.Page converted: 11/30/2000 |
|||||||||
This page last reviewed 5/2/01
|