 |
|
|
|
|
|
|
| ||||||||||
|
|
|
|
|
|
|
||||
| ||||||||||
|
|
|
|
|
Persons using assistive technology might not be able to fully access information in this file. For assistance, please send e-mail to: mmwrq@cdc.gov. Type 508 Accommodation and the title of the report in the subject line of e-mail. National, State, and Urban Area Vaccination Coverage Levels Among Children Aged 19--35 Months --- United States, 1999Childhood vaccinations have a major impact on the reduction and elimination of many causes of morbidity and mortality among children (1). Monitoring vaccination coverage levels is necessary to characterize undervaccinated populations and to evaluate the effectiveness of efforts to increase coverage. The National Immunization Survey (NIS) provides ongoing national estimates of vaccination coverage among children aged 19--35 months based on data for the most recent 12 months for each of the 50 states and 28 geographic areas (2). This report presents the findings of the 1999 NIS*, which indicate that vaccination coverage among U.S. children aged 19--35 months were at or near record high levels. To collect vaccination information for all age-eligible children, NIS uses a quarterly random-digit--dialing sample of telephone numbers for each survey area. During 1999, 33,548 household interviews were completed, representing 34,442 children. The response rate for eligible households for the 78 survey areas was 66.3%. Following the interviews and with parental/guardian consent, data accuracy was verified from vaccination providers. Children with provider data were weighted to represent all children surveyed and to account for nonresponding households, changes in natality patterns, and lower vaccination coverage among children in households without telephones (2). In 1999, national vaccination coverage for three doses of any diphtheria and tetanus toxoids and pertussis vaccine (DTP) was 95.9%; for three doses of poliovirus vaccine, 89.6%; for three doses of Haemophilus influenzae type b vaccine (Hib), 93.5%; for one dose of measles-mumps-rubella vaccine (MMR), 91.5%; for three doses of hepatitis B vaccine (HepB), 88.1%; and for one dose of varicella vaccine (VAR), 59.4%. From 1998 to 1999, national coverage with the combined vaccination series 4:3:1 (four doses of DTP, three doses of poliovirus vaccine, and one dose of measles-containing vaccine) and with 4:3:1:3 (4:3:1 series and three doses of Hib) did not change significantly (Table 1). Coverage with VAR increased from 43% in 1998 to 59% in 1999 (Table 1). In 1999, state-specific coverage for the 4:3:1 series ranged from 70% to 91%, and the 4:3:1:3 series ranged from 69% to 91% (Table 2). For selected urban areas, coverage ranged from 67% to 87% for the 4:3:1 series and from 63% to 87% for the 4:3:1:3 series (Table 2). Reported by: National Center for Health Statistics; Assessment Br, Data Management Div, National Immunization Program, CDC. Editorial Note:National coverage for routinely recommended childhood vaccines has increased substantially since 1993, when the Childhood Immunization Initiative (CII) was implemented by the federal government (3). The findings in this report indicate that national coverage for the recommended vaccines remain at or near record high levels. However, this coverage level cannot ensure protection for children born during or after 1999 even though levels observed in 1999 demonstrate the feasibility of attaining high coverage. Achieving and sustaining the national health objectives for 2010 vaccination coverage and disease-elimination (4) will require developing a functional vaccine-delivery system. This effort will require collaboration between national, state, local, private, and public partners. A comprehensive vaccine-delivery system that would achieve and maintain high vaccination coverage levels (5) and low morbidity in children born during or after 1999 should consist of three components. These components are 1) state- and community-based computerized vaccination registries that include all children from birth, that can identify children needing vaccination, and can recall them for missed vaccinations (6); 2) ongoing quality-assurance and information-feedback activities (7); and 3) education programs for parents and health-care providers. High coverage levels are necessary to maintain and reduce illness, disability, and death associated with vaccine-preventable diseases. Assessment of vaccination coverage levels is an important component of the U.S. immunization program. To maintain the integrity and reliability of the national immunization system, a core surveillance effort that includes immunization coverage levels is essential (8). NIS is the primary source of vaccination coverage data among U.S. preschool-aged children (5). NIS should continue to characterize at-risk children and evaluate the effectiveness of programs designed to increase coverage. References
* For this reporting period (January--December 1999), NIS included children born during February 1996--May 1998. Table 1 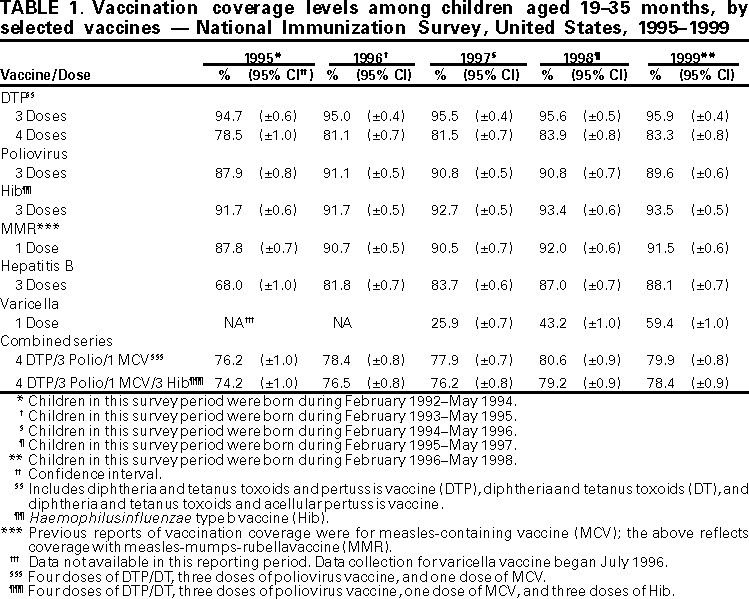 Return to top. Table 2   Return to top. Disclaimer All MMWR HTML versions of articles are electronic conversions from ASCII text into HTML. This conversion may have resulted in character translation or format errors in the HTML version. Users should not rely on this HTML document, but are referred to the electronic PDF version and/or the original MMWR paper copy for the official text, figures, and tables. An original paper copy of this issue can be obtained from the Superintendent of Documents, U.S. Government Printing Office (GPO), Washington, DC 20402-9371; telephone: (202) 512-1800. Contact GPO for current prices. **Questions or messages regarding errors in formatting should be addressed to mmwrq@cdc.gov.Page converted: 7/6/2000 |
|||||||||
This page last reviewed 5/2/01
|