|
|
|
|
|
|
|
| ||||||||||
|
|
|
|
|
|
|
||||
| ||||||||||
|
|
|
|
|
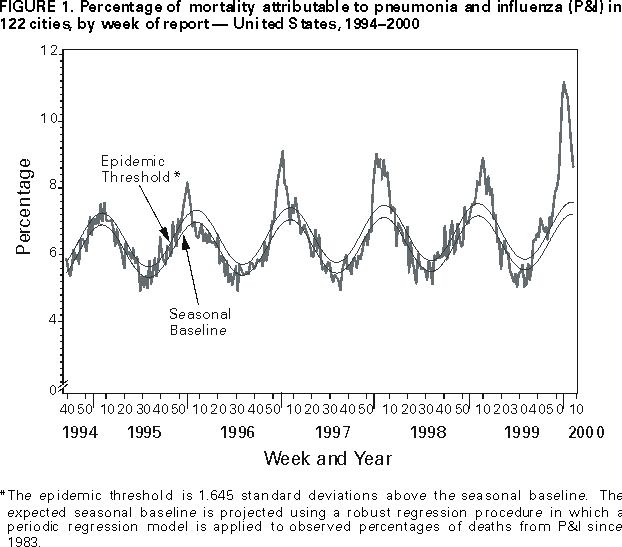
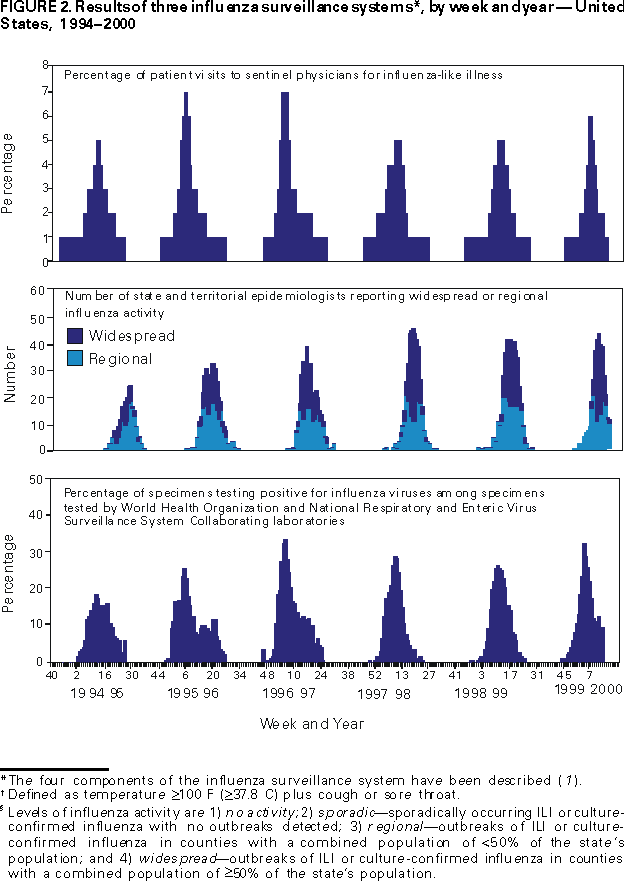
Persons using assistive technology might not be able to fully access information in this file. For assistance, please send e-mail to: mmwrq@cdc.gov. Type 508 Accommodation and the title of the report in the subject line of e-mail. Update: Influenza Activity --- United States, 1999-2000 SeasonPlease note: An erratum has been published for this article. To view the erratum, please click here. Influenza activity in the United States increased substantially during mid-December 1999 and appears to have peaked during the weeks ending December 25 (week 51) through January 15 (week 2). Predominant viruses isolated this season have been influenza type A(H3N2) viruses, antigenically similar to the viruses that have predominated since the 1997-98 influenza season and were well matched to this season's vaccine. This report summarizes influenza activity in the United States during October 3, 1999-February 26, 2000*, and compares the current season with the five previous seasons. For the week ending February 26 (week 8), 1% of overall patient visits to U.S. sentinel physicians were for influenza-like illness (ILI)†. During October 3-February 26, the percentage of patient visits for ILI peaked at 6% during the week ending January 1 (week 52). During the five influenza seasons from 1994-95 through 1998-99, peak percentages of patient visits to sentinel physicians for ILI ranged from 5% to 7%. The weeks with the highest percentage of patient visits for ILI ranged from week 50 to week 7. For the week ending February 26, one state epidemiologist reported widespread§ activity, and 10 reported regional activity. During October -February 26, the highest combined number of reports of either widespread or regional influenza activity by state and territorial epidemiologists was 44 during the week ending January 15 (week 2). During the previous five influenza seasons, the highest total numbers of state and territorial epidemiologists reporting either widespread or regional influenza activity during any week during each of the seasons ranged from 25 to 46. The weeks with the highest number of reports of widespread or regional activity ranged from week 1 to week 10. The percentage of total deaths attributed to pneumonia and influenza (P&I) in the 122 Cities Mortality Reporting System (MRS) was 8.6% for the week ending February 26. This was above the epidemic threshold¶ of 7.6% for that week. During October 3-February 26, the percentage of deaths attributed to P&I peaked at 11.2% during the week ending January 22 (week 3) (Figure 1). During the previous five influenza seasons, peak percentages of deaths attributed to P&I in the 122 Cities MRS ranged from 7.6% to 9.1%. The weeks with peak percentages of deaths attributed to P&I ranged from week 3 to week 10. This season, P&I mortality has been above the epidemic threshold for 20 of the 21 weeks during October 3-February 26. Since the week ending October 3, the World Health Organization collaborating laboratories and the National Respiratory and Enteric Virus Surveillance System laboratories in the United States have tested 73,576 respiratory specimens for influenza viruses; 12,651 (17%) tested positive. For the week ending February 26, of 1118 specimens tested for influenza virus, 111 (10%) tested positive. During October 3-February 26, the highest percentage of specimens testing positive for influenza viruses was 33% during the week ending December 25 (week 51). During the previous five influenza seasons, peak percentages of specimens testing positive for influenza viruses ranged from 19% to 34%. The weeks with peak percentages of specimens testing positive ranged from week 51 to week 6. Of the 12,651 positive specimens reported since October 3, 12,622 (99.8%) were type A, and 29 (0.2%) were type B. Of the 3310 influenza A viruses subtyped as of February 26, 3266 (99%) were H3N2 viruses, and 44 (1%) were H1N1 viruses. CDC has characterized antigenically 380 influenza viruses received from U.S. laboratories since October 3. Of the 359 antigenically characterized influenza A (H3N2) viruses, 336 (94%) were similar to the vaccine strain A/Sydney/05/97, and 23 (6%) showed somewhat reduced titers to ferret antisera produced against the A/Sydney/05/97 virus. This is the third consecutive winter that the influenza A/Sydney/05/97-like viruses have predominated in the United States and worldwide. All four of the antigenically characterized U.S. influenza type B viruses were similar to the B/Beijing/184/93-like virus that is represented in the current vaccine by the B/Yamanashi/166/98 virus. Of the 17 antigenically characterized influenza A(H1N1) viruses, one was similar to the vaccine strain A/Beijing/262/95, eight were similar to the A/Bayern/07/95 virus, and eight were related more closely to the antigenic variant A/New Caledonia/20/99. A/Bayern/07/95-like viruses are distinct antigenically from the A/Beijing/262/95-like viruses; however, the A/Beijing/262/95 vaccine strain produces high titers of antibodies that cross-react with A/Bayern/07/95-like viruses. Reported by: Participating state and territorial epidemiologists and state public health laboratory directors. World Health Organization collaborating laboratories. National Respiratory and Enteric Virus Surveillance System laboratories. Sentinel Physicians Influenza Surveillance System. Surveillance Systems Br, Div of Public Health Surveillance and Informatics, Epidemiology Program Office; Mortality Statistics Br, Div of Vital Statistics, National Center for Health Statistics; WHO Collaborating Center for Reference and Research on Influenza, Respiratory and Enteric Virus Br, and Influenza Br, Div of Viral and Rickettsial Diseases, National Center for Infectious Diseases, CDC. Editorial Note:During the 1999-2000 season, influenza A/Sydney/05/97 (H3N2)-like viruses have predominated, with peak activity occurring during weeks 51-2. Peak activity for this season occurred approximately 4-6 weeks earlier than peak activity during the 1994-95, 1997-98, and 1998-99 influenza seasons but at approximately the same time as the 1995-96 and 1996-97 seasons. Nationally, influenza activity appears to be decreasing. This season's peak percentage of patient visits to sentinel physicians for ILI, peak percentage of respiratory specimens testing positive for influenza viruses, and peak number of state and territorial epidemiologists reporting either widespread or regional influenza activity have been within the range seen during the previous five seasons (Figure 2). However, the peak percentage of deaths attributed to P&I in the 122 Cities MRS has been higher than levels seen during the previous five seasons. The 122 Cities MRS is a voluntary mortality reporting system that provides weekly data throughout the year to estimate the percentage of total deaths attributed to P&I. Factors that affect the percentage of P&I deaths estimated by the 122 Cities MRS include 1) the incidence of influenza in the population, 2) the level of pre-existing immunity to circulating viruses in the general population (as a result of previous natural infection or influenza vaccination), 3) the virulence of circulating influenza viruses, 4) the proportion of the population with conditions placing them at high risk for complications and death attributable to influenza, 5) the incidence and virulence of other respiratory pathogens, and 6) methodologic factors (2,3). The specific combination of factors contributing to the increased percentage of deaths attributed to P&I this season is not clear; however, one contributing factor has been a change in the P&I case definition for the 122 Cities MRS (1). Before the 1999-2000 season, vital statistics offices participating in the 122 Cities MRS were asked to report a death as a P&I death when pneumonia was listed in part I of the death certificate or when influenza was listed anywhere on the death certificate (part I or part II). However, this case definition did not allow P&I mortality cases to be identified easily in computerized mortality systems, and an evaluation of the 122 Cities MRS conducted in 1999 showed that the case definition was not used consistently by all cities (CDC, unpublished data, 1999). Some large cities reported P&I deaths on the basis of underlying causes of death (CDC, unpublished data, 1999). In addition, in January 1999, CDC's National Center for Health Statistics (NCHS) implemented the International Statistical Classification of Diseases and Related Public Health Problems, 10th Revision (ICD-10) (1). Coding rules for the underlying cause of death for pneumonia in ICD-10 substantially differ from those in International Classification of Diseases, Ninth Revision (ICD-9) (4). Among cities that reported P&I deaths using underlying causes of death coded according to ICD-10, a substantial decrease in the number of reported P&I deaths was seen in the second week of January 1999 compared with the previous week (CDC, unpublished data, 1999). In response to inconsistent use of the old case definition and the impact of the change from ICD-9 to ICD-10 on reporting to the 122 Cities MRS in some cities, CDC modified the 122 Cities MRS case definition for reporting P&I deaths for the 1999-2000 season. Cities were asked to report a death as a P&I death when either pneumonia or influenza was listed anywhere on the death certificate (2). The new case definition is simpler and more compatible with computerized mortality systems. Many cities have implemented the new 122 Cities MRS P&I case definition; some cities continue to use underlying cause of death data coded according to ICD-10 for reporting to the 122 Cities MRS. For cities using the new reporting case definition, the number of P&I deaths reported to the 122 Cities MRS would have been expected to increase. The effect of the concurrent ICD-9 to ICD-10 change and reporting case definition change is unclear. To clarify the impact of these changes, CDC will continue to analyze data from the 122 Cities MRS and will compare the data with vital statistics data from the NCHS. In addition, CDC will continue to examine other possible causes of the increased P&I mortality reported to the 122 Cities MRS this season. The increased P&I mortality reported this season must be interpreted with caution because influenza activity levels detected by the other three influenza surveillance systems this season have been similar to those seen during the previous five seasons. Influenza surveillance data collected by CDC are updated weekly from October through May. Summary reports are available through CDC's voice information system, telephone (888) 232-3228, fax (888) 232-3299 (request document number 361100), or through CDC's National Center for Infectious Diseases, Division of Viral and Rickettsial Diseases, Influenza Branch World-Wide Web site, http://www.cdc.gov/ncidod/diseases/flu/weekly.htm . References
* The four components of the influenza surveillance system have been described (1). † Defined as temperature >100 F (>37.8 C) plus cough or sore throat. § Levels of influenza activity are 1) no activity; 2) sporadic---sporadically occurring ILI or culture-confirmed influenza with no outbreaks detected; 3) regional---outbreaks of ILI or culture-confirmed influenza in counties with a combined population of <50% of the state's population; and 4) widespread---outbreaks of ILI or culture-confirmed influenza in counties with a combined population of >50% of the state's population. ¶ The epidemic threshold is 1.645 standard deviations above the seasonal baseline. The expected seasonal baseline is projected using a robust regression procedure in which a periodic regression model is applied to observed percentages of deaths from P&I since 1983.
Disclaimer All MMWR HTML versions of articles are electronic conversions from ASCII text into HTML. This conversion may have resulted in character translation or format errors in the HTML version. Users should not rely on this HTML document, but are referred to the electronic PDF version and/or the original MMWR paper copy for the official text, figures, and tables. An original paper copy of this issue can be obtained from the Superintendent of Documents, U.S. Government Printing Office (GPO), Washington, DC 20402-9371; telephone: (202) 512-1800. Contact GPO for current prices. **Questions or messages regarding errors in formatting should be addressed to mmwrq@cdc.gov.Page converted: 3/9/2000 |
|||||||||
This page last reviewed 5/2/01
|