 |
|
|
|
|
|
|
| ||||||||||
|
|
|
|
|
|
|
||||
| ||||||||||
|
|
|
|
|
Persons using assistive technology might not be able to fully access information in this file. For assistance, please send e-mail to: mmwrq@cdc.gov. Type 508 Accommodation and the title of the report in the subject line of e-mail. Update: Influenza Activity -- United States, 1999-2000 SeasonInfluenza activity in the United States began to increase substantially during mid-December 1999, and as of January 15, 2000, laboratory-confirmed influenza infections have been reported from all nine surveillance regions. The predominant viruses isolated this season have been influenza type A(H3N2) viruses that have been circulating in the United States for the last two influenza seasons and are well-matched to this season's vaccine. This report summarizes influenza activity in the United States during October 3, 1999-January 15, 2000.* During October 3-January 15, the highest percentage of patient visits to U.S. sentinel physicians for influenza-like illness (ILI)** was 6% during the week ending January 1 (week 52) (Figure 1). During that week, the percentage of patient visits for ILI was elevated above baseline levels (0-3%) in all nine regions. For the week ending January 15 (week 2), 4% of overall patient visits were for ILI. During October 3-January 15, the highest numbers of state and territorial epidemiologists reporting either widespread or regional influenza activity*** during any weeks were 42 during the week ending January 8 (week 1) and 43 during the week ending January 15 (week 2). For the week ending January 15, 31 states reported widespread activity, and 12 states reported regional activity. The highest percentage of deaths attributed to pneumonia and influenza (P&I) in the 122 Cities Mortality Reporting System was 10.5% during week 2. This was above the epidemic threshold**** of 7.4% for that week and increased from 9.3% in week 1 (Figure 2). Since the week ending October 3, the World Health Organization collaborating laboratories and the National Respiratory and Enteric Virus Surveillance System laboratories in the United States have tested 41,034 respiratory specimens for influenza viruses; of these, 7361 (18%) tested positive. Of the positive specimens, 7338 (99.7%) were type A, and 23 (0.3%) were type B. For the week ending January 15, 21% of specimens tested for influenza viruses were positive, a decrease from the highest level of 33% during the week ending December 25. Of the 1665 influenza A isolates subtyped as of January 15, 1659 (99.6%) were H3N2 viruses, and six (0.4%) were H1N1 viruses. CDC has characterized antigenically 246 influenza viruses received from U.S. laboratories since October 1. Of the 239 influenza A(H3N2) viruses tested, 214 (90%) were similar to the vaccine strain A/Sydney/05/97, and 25 (10%) showed somewhat reduced titers to ferret antisera produced against the A/Sydney/05/97 virus. All four of the U.S. influenza type B viruses antigenically characterized were similar to B/Beijing/184/93-like virus, which is represented in the current vaccine by the B/Yamanashi/166/98 virus. Of the three influenza A(H1N1) viruses antigenically characterized, two were similar to A/Beijing/262/95, the H1N1 component of the current vaccine, and one was related more closely to the antigenic variant A/New Caledonia/20/99. This is the third consecutive winter that the influenza A/Sydney/05/97-like (H3N2) viruses have been the predominant influenza viruses. Reported by: Participating state and territorial epidemiologists and state public health laboratory directors. World Health Organization collaborating laboratories. National Enteric Virus Surveillance System Organization collaborating laboratories. Sentinel Physicians Influenza Surveillance System. Surveillance Systems Br, Div of Public Health Surveillance and Informatics, Epidemiology Program Office; Mortality Statistics Br, Div of Vital Statistics, National Center for Health Statistics; WHO Collaborating Center for Reference and Research on Influenza, Respiratory and Enterovirus Br, and Influenza Br, Div of Viral and Rickettsial Diseases, National Center for Infectious Diseases; and an EIS Officer, CDC. Editorial Note:For the 1999-2000 season, influenza activity began to increase in mid-December, approximately 4 weeks earlier than in the 1997-98 season, and 7-8 weeks earlier than in the 1998-99 season. Influenza seasons are usually variable in onset, duration, timing of peak periods, and regional and overall health impact from year to year. As of January 15, 2000, the percentage of patient visits for ILI to sentinel physicians, the percentage of respiratory specimens testing positive for influenza, and the number of state and territorial epidemiologists reporting either widespread or regional influenza activity have been similar to the last two seasons. Recent declines in visits to sentinel physicians for ILI and in the percentage of respiratory specimens testing positive for influenza viruses suggest that influenza activity may have peaked nationally. As of January 15, the percentage of mortality attributable to P&I in the 122 Cities Mortality Reporting System had not yet begun to decline, and the level of 10.5% was higher than any week during the last two A(H3N2) seasons. During the previous 3 years, P&I mortality levels have peaked between 8.8% and 9.1% of all deaths. This indicator of influenza activity typically lags behind other influenza surveillance indicators by approximately 2 weeks. Increased P&I mortality could be caused by several factors, including high levels of influenza infection, deaths associated with other respiratory infections, and changes made this season to the case definition for reporting P&I deaths (1). During winter months, other infectious pathogens such as respiratory syncytial virus (RSV), adenoviruses, parainfluenza viruses, rhinoviruses, coronavirus, mycoplasma, and bacterial infections also can cause respiratory illness. For example, national surveillance data indicate that RSV activity has been widespread this season (2); RSV activity peaks during the winter months (3). Although viral culture of respiratory specimens obtained 1-4 days after illness onset remains the "gold standard" for confirming influenza virus infection, several commercial rapid diagnostic tests are available to test respiratory specimens for influenza. Such tests have reported sensitivities and specificities of 65%-87% and 93%-100%, respectively, and include tests that detect only influenza type A, or tests that detect both influenza type A and type B viruses, but do not distinguish between them (4,5). Rapid diagnostic tests use various clinical specimens and have not been compared in a controlled study. Four prescription antiviral agents are approved for treating uncomplicated influenza. Amantadine and rimantadine are approved for treating influenza A, while the neuraminidase inhibitor drugs zanamivir and oseltamivir are approved to treat both influenza A and B (6-8). Amantadine and rimantadine also are approved for prophylaxis of influenza A, but neither zanamivir nor oseltamivir are approved for prophylactic use. On January 12, the Food and Drug Administration issued an advisory letter emphasizing that physicians should 1) always consider the possibility of primary or concomitant bacterial infection when making treatment decisions for patients with suspected influenza, and 2) use special caution if prescribing zanamivir to patients with underlying asthma or chronic obstructive pulmonary disease (9). All four antiviral agents can reduce the duration of influenza symptoms by approximately 1 day if treatment is started within 48 hours of symptom onset, but differ substantially in adverse effects, approved age-group use, and cost (7-8,10). CDC has issued a summary concerning the use of the neuraminidase inhibitors (7). None of the antiviral medications used to treat influenza are beneficial in treating other infectious diseases. Despite the use of rapid diagnostic tests and availability of neuraminidase inhibitor drugs, influenza vaccination remains the most important measure to protect persons against influenza. At this time of year, influenza vaccine supplies are limited, but unvaccinated persons at high risk for complications from influenza (e.g., persons aged greater than or equal to 65 years; adults and children who have chronic disorders of the pulmonary [including asthma] or cardiovascular system and chronic metabolic diseases [including diabetes]; and women in their second or third trimester of pregnancy) should consider vaccination if influenza vaccine is available in their area (6). Influenza surveillance data collected by CDC are updated weekly from October through May. Summary reports are available through CDC's voice information system, telephone (888) 232-3228, fax (888) 232-3299 (request document number 361100), or through CDC's National Center for Infectious Diseases, Division of Viral and Rickettsial Diseases, Influenza Branch World-Wide Web site, http://www.cdc.gov/ncidod/diseases/flu/weekly.htm. References
* The four components of the influenza surveillance system have been described (1). ** Defined as temperature greater than or equal to 100 F (greater than or equal to 37.8 C) plus either cough or sore throat. *** Levels of activity are 1) no activity; 2) sporadic--sporadically occurring ILI or culture-confirmed influenza with no outbreaks detected; 3) regional--outbreaks of ILI or culture-confirmed influenza in counties with a combined population of less than 50% of the state's population; and 4) widespread--outbreaks of ILI or culture-confirmed influenza in counties with a combined population of greater than or equal to 50% of the state's population. **** The epidemic threshold is 1.645 standard deviations above the seasonal baseline. The expected seasonal baseline is projected using a robust regression procedure in which a periodic regression model is applied to observed percentages of deaths from P&I since 1983. Figure 1 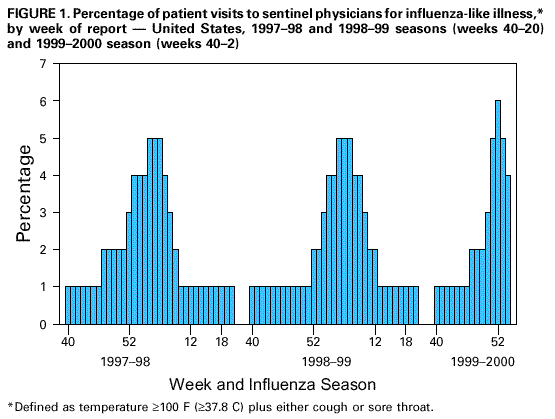 Return to top. Figure 2 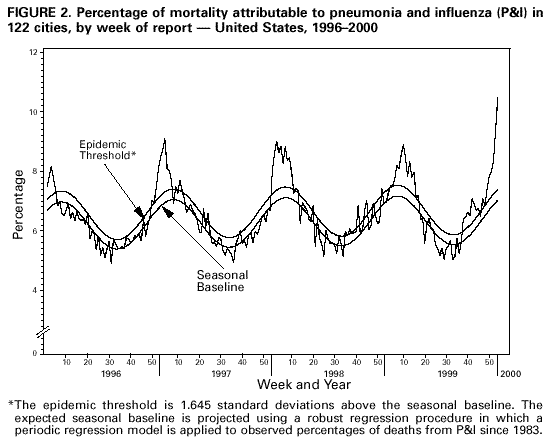 Return to top. Disclaimer All MMWR HTML versions of articles are electronic conversions from ASCII text into HTML. This conversion may have resulted in character translation or format errors in the HTML version. Users should not rely on this HTML document, but are referred to the electronic PDF version and/or the original MMWR paper copy for the official text, figures, and tables. An original paper copy of this issue can be obtained from the Superintendent of Documents, U.S. Government Printing Office (GPO), Washington, DC 20402-9371; telephone: (202) 512-1800. Contact GPO for current prices. **Questions or messages regarding errors in formatting should be addressed to mmwrq@cdc.gov.Page converted: 1/26/2000 |
|||||||||
This page last reviewed 5/2/01
|