 |
|
|
|
|
|
|
| ||||||||||
|
|
|
|
|
|
|
||||
| ||||||||||
|
|
|
|
|
Persons using assistive technology might not be able to fully access information in this file. For assistance, please send e-mail to: mmwrq@cdc.gov. Type 508 Accommodation and the title of the report in the subject line of e-mail. HIV/AIDS Among Racial/Ethnic Minority Men Who Have Sex with Men -- United States, 1989-1998Please note: A clarification has been published for this article. To view the clarification, please click here. In the United States, racial/ethnic minority populations account for an increasing proportion of acquired immunodeficiency syndrome (AIDS) cases, including cases among men who have sex with men (MSM) (1). This report presents recent trends in AIDS incidence and deaths among MSM who belong to racial/ethnic minority populations*, and compares data on human immunodeficiency virus (HIV) diagnoses with AIDS diagnoses during 1996-1998 among racial/ethnic minority MSM in the 25 states** that have conducted confidential HIV surveillance and AIDS case surveillance since 1994. The findings indicate that among MSM, non-Hispanic black and Hispanic men accounted for an increasing proportion of AIDS cases and had smaller proportionate declines in AIDS incidence and deaths from 1996 to 1998. Of HIV and AIDS diagnoses among racial/ethnic minority MSM, the proportion who are young (aged 13-24 years) is higher than among white MSM. Trends in AIDS incidence during 1989-1998 among MSM aged greater than or equal to 13 years from the 50 states, the District of Columbia, and U.S. territories were analyzed by race/ethnicity, age, and geographic area of residence. During 1996-1998, AIDS incidence per 100,000 population was calculated using race/ethnicity-specific Bureau of the Census estimates of males aged greater than or equal to 13 years for the corresponding years. The number of HIV infection and AIDS diagnoses and deaths among persons with AIDS was adjusted for reporting delays on the basis of cases reported to CDC through June 30, 1999, and for the anticipated reclassification of cases initially reported without HIV-infection risk-exposure data (1). Trends examined were from 1989 through 1998 and from 1996 through 1998, the period of highly active antiretroviral therapy (HAART). During 1996-1998, for the 25 states with confidential HIV surveillance, age and race/ethnicity of MSM whose disease status was HIV infection (not AIDS) when initially diagnosed were compared with MSM who had AIDS-defining conditions when first diagnosed. Characteristics of MSM with AIDS During 1996-1998, 64,685 MSM were diagnosed with AIDS (Table 1); 31,866 (49%) were racial/ethnic minority MSM. Among this group, 1492 (5%) were aged 13-24 years and 4498 (14%) were aged 25-29 years, compared with 2% and 9%, respectively, of white MSM in those age categories. Metropolitan statistical areas (MSAs) of greater than or equal to 500,000 population accounted for 27,097 (85%) AIDS cases in racial/ethnic minority MSM. The AIDS incidence in MSM per 100,000 adult male population decreased 32% from 1996 to 1998 (Table 1); rates were highest for black MSM in all years. The five MSAs that accounted for the largest number of racial/ethnic minority MSM with AIDS during 1996-1998 were New York, 3673 (12%); Los Angeles, 2811 (9%); Miami, 1554 (5%); Washington, DC, 1251 (4%); and Chicago, 1075 (3%). New York and Los Angeles had the largest number of AIDS cases among non-Hispanic black and Hispanic MSM, respectively. Los Angeles and Phoenix were the MSAs with the largest number of AIDS cases among Asian/Pacific Islander (A/PI) and American Indian/Alaska Native (AI/AN) MSM, respectively, compared with New York for white MSM (Table 2). Trends in AIDS Incidence and Deaths Among MSM with AIDS During 1989-1998, AIDS was diagnosed in 290,582 MSM. In 1989, racial/ethnic minority MSM accounted for 24,444 (31%) AIDS cases among MSM, and by 1998, racial/ethnic minority MSM accounted for 18,153 (52%) AIDS cases among MSM (Figure 1). The proportion of MSM with AIDS who were non-Hispanic black and Hispanic increased from 19% and 12%, respectively, in 1989, to 33% and 18%, respectively, in 1998. A/PI and AI/AN each accounted for less than 2% of AIDS cases among MSM throughout this period. AIDS incidence among all MSM declined 22% from 1996 to 1997 (Table 1). The rate of decline slowed to 12% in 1998 compared with 1997. During 1996-1998, AIDS incidence declined among MSM in all racial/ethnic groups: A/PI (43%), non-Hispanic white (39%), AI/AN (35%), Hispanic (26%), and non-Hispanic black (23%). Overall, the proportionate declines in AIDS incidence from 1997 to 1998 were smaller than those from 1996 to 1997. From 1997 to 1998, AIDS incidence declined 29% among AI/AN, 17% among A/PI, 15% among non-Hispanic white, 10% among non-Hispanic black, and 9% among Hispanic MSM. Deaths among all MSM with AIDS declined 49% from 1996 to 1997 (Table 1). The rate of decline slowed to 23% in 1998 compared with 1997. From 1996 to 1998, AIDS deaths declined among all racial/ethnic MSM: A/PI (69%), non-Hispanic white (65%), AI/AN (63%), Hispanic (60%), and non-Hispanic black (53%). From 1997 to 1998, AIDS deaths declined 38% among AI/AN, 37% among A/PI, 24% among non-Hispanic white, 22% among Hispanic, and 21% among non-Hispanic black MSM. HIV and AIDS Diagnoses Among MSM in 25 Areas with HIV/AIDS Surveillance During 1996-1998, HIV infection or AIDS was diagnosed in 23,680 MSM in 25 states with HIV reporting; 11,313 (48%) were racial/ethnic minority MSM: 9497 (40%) non-Hispanic black, 1551 (7%) Hispanic, 113 (less than 1%) A/PI, and 152 (less than 1%) AI/AN. Among MSM whose initial diagnosis was HIV infection, the proportion aged 13-24 years varied by race/ethnicity: 16% non-Hispanic black, 15% A/PI, 15% AI/AN, 13% Hispanic, and 9% non-Hispanic white. Among MSM whose initial diagnosis was AIDS, the proportion aged 13-24 years also varied by race/ethnicity: 6% Hispanic, 6% A/PI, 5% non-Hispanic black, 1% non-Hispanic white, and less than 1% AI/AN. Reported by: State and territorial health departments; Div of HIV/AIDS Prevention-Surveillance and Epidemiology, National Center for HIV, STD, and TB Prevention; and an EIS Officer, CDC. Editorial Note:These HIV/AIDS surveillance data highlight the importance of increased efforts to promote HIV prevention and treatment services in racial/ethnic minority communities, particularly among non-Hispanic black and Hispanic MSM. These groups had higher AIDS rates and the smallest proportionate decreases in AIDS incidence. The annual number of AIDS cases remains high, although AIDS incidence and deaths have declined among racial/ethnic minority MSM. Threse declines reflect the beneficial impact of HIV prevention programs, HAART, and opportunistic infection prophylaxis. Young non-Hispanic black and Hispanic MSM remain at high risk for HIV infection as indicated by higher proportions of AIDS and HIV cases among non-Hispanic black and Hispanic MSM aged 13-24 years compared with white MSM. The disproportionate impact of HIV/AIDS on racial/ethnic minority MSM indicated in this report is probably a minimum estimate. The use of all men aged greater than or equal to 13 years as a denominator (instead of MSM) results in an underestimate of the rate among MSM. Small numbers of cases among A/PI and AI/AN MSM limit the ability to assess trends, although in some locations A/PI and AI/AN MSM might be at substantial risk. HIV/AIDS surveillance data also may underestimate cases among racial/ethnic minorities because of misclassified race/ethnicity in medical records (2), which is greatest among AI/AN, A/PI, and Hispanic groups. States that conduct HIV reporting are not representative of the geographic regions with large Hispanic populations. Race/ethnicity itself is not a risk factor for HIV infection; however, among racial/ethnic minority MSM, social and economic factors, such as homophobia (3), high rates of poverty and unemployment, and lack of access to health care, are associated with high rates of HIV risk behavior (4). These factors also may be barriers to receiving HIV prevention information or accessing HIV testing, diagnosis, and treatment. Characteristics of persons in whom HIV infection (without AIDS) is diagnosed reflect more recent trends in the epidemic than do characteristics of persons with AIDS. In states with confidential HIV surveillance, a larger proportion of racial/ethnic minority MSM were young (aged 13-24 years) when first diagnosed with HIV infection (without AIDS) compared with white MSM, suggesting that racial/ethnic minority MSM may become infected at younger ages compared with white MSM. Trends in AIDS incidence and deaths are affected now by HIV incidence and by HAART; pre-HAART diagnoses of AIDS were not as substantially affected by treatment. HIV case reports may reflect targeted testing patterns in at-risk populations or differences in test-seeking behavior. However, the increased proportion of racial/ethnic minority MSM among MSM with AIDS and the trends in HIV infection diagnoses, particularly among non-Hispanic black men, are consistent with data from seroprevalence and incidence studies among MSM (5,6), which document the high risk for HIV infection among young racial/ethnic minority MSM. Together with AIDS data, HIV data highlight the extent of the need for prevention and treatment to reduce HIV-related morbidity and mortality in this population. To reduce infection rates and improve the likelihood of survival, prevention programs for racial/ethnic minority MSM need to focus on both HIV-infected and uninfected populations. Challenges to the design and implementation of HIV prevention programs among racial/ethnic minority MSM include reaching MSM who may not identify themselves as homosexual or bisexual, recognizing the importance of representing racial/ethnic minority MSM in HIV prevention planning, addressing language barriers, and improving access to HIV testing and health care. Within racial/ethnic minority communities, the stigma attached to acknowledging homosexual and bisexual activity may inhibit racial/ethnic minority MSM from identifying themselves as homosexual or bisexual (7), and they may be more likely to identify with their racial/ethnic minority community than with the MSM community (8). In a CDC-sponsored study of 8780 MSM with HIV infection or AIDS, 24% of non-Hispanic black MSM, 15% of Hispanic MSM, and 11% of A/PI MSM identified themselves as heterosexual compared with 7% of AI/AN and 6% of non-Hispanic white MSM (CDC, unpublished data, 1999). Racial/ethnic minority community leaders should promote dialogue about issues of sexual orientation to overcome social barriers to HIV prevention for racial/ethnic minority MSM (3), especially among young men. MSM remain a population at high risk for HIV infection, and continued efforts to promote behavioral risk reduction among at-risk youth are needed. Serologic surveys, HIV/AIDS case surveillance, and supplemental research and evaluation studies of racial/ethnic minority MSM and other HIV-infected and at-risk populations are needed to target intervention programs (9). In 1999, CDC funded a special program to enhance HIV prevention services for racial/ethnic minority MSM (10). CDC and other federal agencies are collaborating to facilitate links between prevention and treatment services for infected and at-risk populations. References
* Non-Hispanic black, Hispanic, American Indian/Alaska Native, and Asian/Pacific Islander men aged greater than or equal to 13 years who have sex with men. ** Alabama, Arizona, Arkansas, Colorado, Idaho, Indiana, Louisiana, Michigan, Minnesota, Mississippi, Missouri, Nevada, New Jersey, North Carolina, North Dakota, Ohio, Oklahoma, South Carolina, South Dakota, Tennessee, Utah, Virginia, West Virginia, Wisconsin, and Wyoming. Table 1 Note: To print large tables and graphs users may have to change their printer settings to landscape and use a small font size. TABLE 1. Number and rate of AIDS cases and deaths from AIDS among men aged >=13 years who have sex with men, and estimated number and percentage in whom AIDS was diagnosed, by race/ethnicity, age at diagnosis, geographic region, and size of metropolitan statistical area (MSA) -- United States, 1996-1998
* Estimates are adjusted for delays in reporting of AIDS cases and anticipated redistribution of cases initially reported with no identified risk; data reported to CDC through June 1999. Return to top. Figure 1 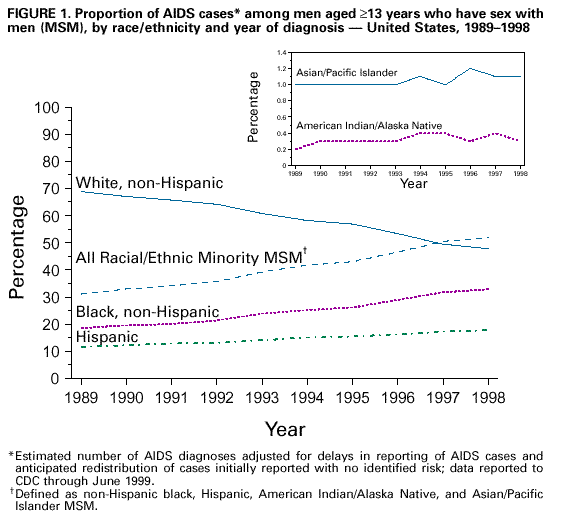 Return to top. Table 2 Note: To print large tables and graphs users may have to change their printer settings to landscape and use a small font size. TABLE 2. Metropolitan statistical areas (MSAs)* with the highest number of AIDS cases† among men aged >=13 years who have sex with men (MSM) -- United States, 1996-1998
* Includes only metropolitan areas with a population >=500,000. Metropolitan areas are named for a central city or county, may include several cities and counties, and may cross state boundaries. Return to top. Disclaimer All MMWR HTML versions of articles are electronic conversions from ASCII text into HTML. This conversion may have resulted in character translation or format errors in the HTML version. Users should not rely on this HTML document, but are referred to the electronic PDF version and/or the original MMWR paper copy for the official text, figures, and tables. An original paper copy of this issue can be obtained from the Superintendent of Documents, U.S. Government Printing Office (GPO), Washington, DC 20402-9371; telephone: (202) 512-1800. Contact GPO for current prices. **Questions or messages regarding errors in formatting should be addressed to mmwrq@cdc.gov.Page converted: 1/13/2000 |
|||||||||||||||||||||||||||||||||||||||||||||||||||||||||||||||||||||||||||||||||||||||||||||||||||||||||||||||||||||||||||||||||||||||||||||||||||||||||||||||||||||||||||||||||||||||||||||||||||||||||||||||||||||||||||||||||||||||||||||||||||||||||||||||||||||||||||||||||||||||||||||||||||||||||||||||||||||||||||||||||||||||||||||||||||||||||||||||||||||||||||||||||||||||||||||||||||||||||||||||||||||||||||||||||||||||||||||||||||||||||||||||||||||||||||||||||||||||||||||||||||||||||||||
This page last reviewed 5/2/01
|