Skip Navigation LinksSkip Navigation Links
Centers for Disease Control and Prevention
Safer Healthier People
Blue White
Blue White
bottom curve
CDC Home Search Health Topics A-Z spacer spacer
spacer
Blue curve MMWR spacer
spacer
spacer

Notifiable Diseases/Deaths in Selected Cities Weekly Information

Figure I   Selected notifiable disease reports, comparison of provisional 4-week totals ending January 1, 2000, with historical data -- United States

Table I   Summary -- provisional cases of selected notifiable diseases, United States, cumulative, week ending January 1, 2000 (52nd Week)

Table II   Provisional cases of selected notifiable diseases, United States, weeks ending January 1, 2000 and January 2, 1999 (52nd Week)

Table III   Provisional cases of selected notifiable diseases preventable by vaccination, United States, weeks ending January 1, 2000 and January 2, 1999 (52nd Week)

Table IV   Deaths in 122 U.S. cities, week ending January 1, 2000 (52nd Week)


Figure I

Figure I
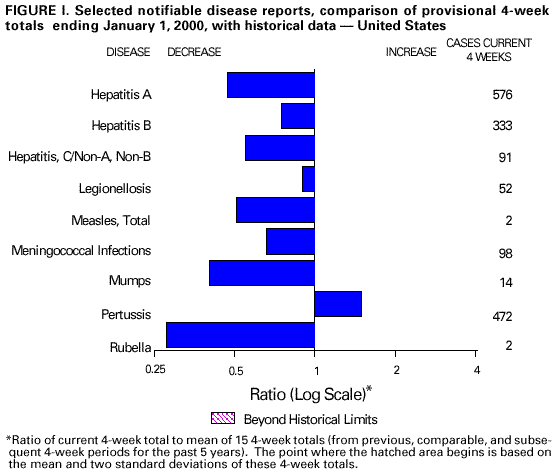
Return to top.

Table I
Note: To print large tables and graphs users may have to change their printer settings to landscape and use a small font size.
TABLE I. Summary -- provisional cases of selected notifiable diseases, United
States, cumulative, week ending January 1, 2000 (52nd Week)
==================================================================================
                                             Cum. 1999
------------------------------------------------------
Anthrax                                              -
Brucellosis*                                        49
Cholera                                              3
Congenital rubella syndrome                          8
Cyclosporiasis*                                     51
Diphtheria                                           1
Encephalitis:  California*                          61
               eastern equine*                       5
               St. Louis*                            7
               western equine*                       1
Ehrlichiosis:  human granulocytic (HGE)*           163
               human monocytic (HME)*               40
Hansen Disease*                                     98
Hantavirus pulmonary syndrome*                      21
Hemolytic uremic syndrome, post-diarrheal*         119
HIV infection, pediatric*&                         159
Plague                                               8
Poliomyelitis, paralytic                             -
Psittacosis*                                        16
Rabies, human                                        -
Rocky Mountain spotted fever (RMSF)                567
Streptococcal disease, invasive Group A          2,196
Streptococcal toxic-shock syndrome*                 41
Syphilis, congenital@                              277
Tetanus                                             33
Toxic-shock syndrome                               117
Trichinosis                                         11
Typhoid fever                                      299
Yellow fever                                         1
------------------------------------------------------
-: no reported cases
 * Not notifiable in all states
 + Updated weekly from reports to the Division of Viral and Rickettsial
   Diseases, National Center for Infectious Diseases (NCID).
 & Updated monthly from reports to the Division of HIV/AIDS Prevention --
   Surveillance and Epidemiology, National Center for HIV, STD, and TB
   Prevention (NCHSTP), last update December 26, 1999.
 @ Updated from reports to the Division of STD Prevention, NCHSTP.

==================================================================================


Return to top.

Table II
Note: To print large tables and graphs users may have to change their printer settings to landscape and use a small font size.
TABLE II. (page 1) Provisional cases of selected notifiable diseases, United States, weeks ending
January 1, 2000, and January 2, 1999 (52nd Week)

                                                                                                    Escherichia
                                                                                                   coli O157:H7*
                                                                                     -----------------------------------------
                          AIDS              Chlamydia          Cryptosporidiosis            NETSS                  PHLIS
                   -----------------   --------------------   -------------------    -------------------      ----------------
                     Cum.       Cum.        Cum.       Cum.       Cum.       Cum.        Cum.       Cum.       Cum.       Cum.
Reporting Area       1999**     1998        1999       1998       1999       1999        1999       1998       1999       1998
------------------------------------------------------------------------------------------------------------------------------
UNITED STATES      45,000     46,019     591,504    597,125      2,379      3,793       3,483      3,161      2,476      2,172

NEW ENGLAND         2,293      1,786      20,599     20,092        163        152         396        340        347        286
Maine                  80         31         904      1,073         30         33          38         37          -          -
N.H.                   46         36         942        960         20         18          34         48         34         47
Vt.                    20         20         472        413         36         26          32         21         21         18
Mass.               1,454        906       8,874      8,362         53         68         173        153        187        164
R.I.                  108        127       2,300      2,307          6          7          27         14         26          1
Conn.                 585        666       7,107      6,977         18          U          92         67         79         56

MID. ATLANTIC      11,713     12,525      57,408     61,517        429        580         328        312        101         87
Upstate N.Y.        1,690      1,576           N          N        184        343         266        231          9          -
N.Y. City           6,013      7,093      21,963     26,129        116        208          11         14         17         13
N.J.                2,043      2,118      11,125     11,686         36         29          51         67         46         53
Pa.                 1,967      1,738      24,320     23,702         93          N           N          N         29         21

E.N. CENTRAL        3,268      3,376      87,491    101,474        580        737         726        464        509        374
Ohio                  547        682      27,104     27,786         67         75         267        128        214         77
Ind.                  363        485      11,595     11,267         40         63         114        106         67         54
Ill.                1,557      1,295      26,613     26,363         73         84         227        113         81         81
Mich.                 649        711      22,179     22,156         49         39         118        117         78         74
Wis.                  152        203           U     13,902        351        476           N          N         69         88

W.N. CENTRAL        1,069        917      34,317     35,929        208        374         620        499        537        408
Minn.                 190        188       6,795      6,970         79        173         238        209        185        215
Iowa                   87         72       4,731      5,174         56         66         116         93         75         60
Mo.                   531        440      12,950     12,670         31         29          67         55         68         64
N. Dak.                 7          6         707      1,045         18         34          17         12         18         15
S. Dak.                16         15       1,530      1,572          7         25          47         37         62         40
Nebr.                  67         73       3,378      2,911         16         36         114         57        113          -
Kans.                 171        123       4,226      5,587          1         11          21         36         16         14

S. ATLANTIC        12,460     12,074     124,550    116,821        396        430         350        404        181        179
Del.                  186        172       2,761      2,608          -          3           6          -          3          2
Md.                 1,525      1,631      11,256      7,560         17         21          44         43          4         15
D.C.                  838        988           N          N          8         25           1          1          U          U
Va.                   943        995      13,734     13,561         28         22          77          N         60         55
W. Va.                 69         84       1,240      2,386          3          3          16         14         11         10
N.C.                  794        788      21,812     22,197         35          N          74        186         52         47
S.C.                  959        777      12,983     18,312          -          -          21         15         14         12
Ga.                 1,678      1,293      31,702     25,242        147        152          41         84          -          -
Fla.                5,468      5,346      29,062     24,955        158        204          70         61         37         38

E.S. CENTRAL        1,933      1,873      44,924     40,438         48         27         134        120         69         67
Ky.                   277        280       7,379      6,083          8         10          48         36          -          -
Tenn.                 759        694      13,850     13,717         13         11          55         54         44         41
Ala.                  476        484      12,384     10,065         15          N          25         24         21         20
Miss.                 421        415      11,311     10,573         12          6           6          6          4          6

W.S. CENTRAL        4,377      5,387      88,218     88,722         88        932         139        137        129        108
Ark.                  194        203       5,585      4,123          2          6          15         12          8         10
La.                   854        947      15,948     14,770         25         20          12         14         15          7
Okla.                 148        285       8,186      9,393         13          N          39         26         29          9
Tex.                3,181      3,952      58,499     60,436         48        906          73         85         77         82

MOUNTAIN            1,742      1,625      30,509     34,291        101        124         342        367        227        249
Mont.                  13         29       1,496      1,330         13         10          25         17          -          5
Idaho                  25         32       1,750      2,016          8         17          78         43         43         25
Wyo.                   15          6         788        725          1          2          17         53         14         55
Colo.                 319        313       5,474      9,113         14         19         112         90         88         69
N. Mex.                93        209       3,931      4,179         42         48          13         19          7         20
Ariz.                 880        639      12,069     11,399         15         19          38         46         24         29
Utah                  155        139       2,219      2,209          N          N          39         75         49         22
Nev.                  242        258       2,782      3,320          8          9          20         24          2         24

PACIFIC             6,145      6,456     103,488     97,841        366        437         448        518        376        414
Wash.                 360        436      11,973     10,998          N          N         172        143        159        131
Oreg.                 225        204       5,901      5,855         93         70          74        107         69        102
Calif.              5,445      5,626      80,959     76,477        273        363         190        261        136        165
Alaska                 15         29       1,859      1,907          -          1           1          7          1          -
Hawaii                100        161       2,796      2,604          -          3          11          -         11         16

Guam                   10          2         299        432          -          -           N          N          U          U
P.R.                1,247      1,710           U          U          -          N           9          5          U          U
V.I.                   39         35           U          U          U          U           U          U          U          U
Amer. Samoa             -          -           U          U          U          U           U          U          U          U
C.N.M.I.                -          -           U          U          U          U           U          U          U          U
------------------------------------------------------------------------------------------------------------------------------
N: Not notifiable    U: Unavailable    -: no reported cases    C.N.M.I.: Commonwealth of North Mariana Islands

 * Individual cases may be reported through both the National Electronic Telecommunications System for Surveillance (NETSS)
   and the Public Health Laboratory Information System (PHLIS).
** Updated monthly from reports to the Division of HIV/AIDS Prevention -- Surveillance and Epidemiology, National Center for HIV,
   STD, and TB Prevention, last update December 26, 1999.

=======================================================================================================================================================

TABLE II. (page 2) Provisional cases of selected notifiable diseases, United States, weeks ending
January 1, 2000, and January 2, 1999 (52nd Week)

                                            Hepatitis                                       Lyme
                       Gonorrhea             C/NA,NB             Legionellosis             Disease
                   -----------------   --------------------   -------------------    -------------------
                     Cum.       Cum.        Cum.       Cum.       Cum.       Cum.        Cum.       Cum.
Reporting Area       1999       1998        1999       1998       1999       1998        1999       1998
--------------------------------------------------------------------------------------------------------
UNITED STATES     327,510    354,482       3,328      3,518        956      1,355      13,306     16,801

NEW ENGLAND         6,469      6,061          15         61         84         98       3,856      5,056
Maine                  71         67           2          -          3          1          41         78
N.H.                  110         91           -          -          8          7          26         45
Vt.                    50         38           7          6         15          7          24         11
Mass.               2,476      2,258           3         51         31         34         999        699
R.I.                  586        430           3          4         12         26         464        789
Conn.               3,176      3,177           -          -         15         23       2,302      3,434

MID. ATLANTIC      38,806     38,559          97        246        191        332       7,369      9,311
Upstate N.Y.        6,869      7,304          62        124         63        113       4,046      4,409
N.Y. City          13,701     12,100           -          -          9         37          45        231
N.J.                6,294      7,858           -          U         18         18         966      1,911
Pa.                11,942     11,297          35        122        101        164       2,312      2,760

E.N. CENTRAL       57,625     69,359       1,444        673        264        420         229        774
Ohio               16,496     18,275           4          8         85        133          78         47
Ind.                6,050      6,643           1          6         46         83          21         39
Ill.               19,726     21,735          48         41         27         54          12         14
Mich.              15,353     16,359         800        470         60         82           1         17
Wis.                    U      6,347         591        148         46         68         117        657

W.N. CENTRAL       14,564     17,912         334         52         57         80         327        317
Minn.               2,603      2,708          13         20         13         12         253        261
Iowa                1,160      1,616           -          8         15         11          22         27
Mo.                 7,318      9,463         309         15         17         18          28         12
N. Dak.                71         78           1          -          2          -           1          -
S. Dak.               190        221           -          -          3          7           -          -
Nebr.               1,396      1,204           5          5          7         21          11          4
Kans.               1,826      2,622           6          4          -         11          12         13

S. ATLANTIC        94,256     96,663         199        197        152        170       1,172        977
Del.                1,662      1,556           1          -         15         13          64         77
Md.                 9,343      9,987          42         23         34         38         826        659
D.C.                3,365      4,480           1          -          5          9           6          8
Va.                 9,399      9,265          11         13         40         27         119         73
W. Va.                387        856          21          9          N          N          19         13
N.C.               19,426     19,221          34         26         15         14          74         63
S.C.                8,592     11,585          22         20         12         12           7          8
Ga.                21,433     20,630           3          9          3          8           -          5
Fla.               20,649     19,083          64         97         28         49          57         71

E.S. CENTRAL       35,567     38,787         333        284         48         66         108        115
Ky.                 3,349      3,577          25         23         22         27          19         27
Tenn.              11,093      11,84         117        173         22         23          57         47
Ala.               10,933     12,737           1          5          4          9          19         24
Miss.              10,192     10,633         190         83          -          7          13         17

W.S. CENTRAL       49,772     54,772         467        655         27         42          61         68
Ark.                2,984      3,953          19         30          -          2           7          8
La.                12,804     12,743         253        137          4          6          11         15
Okla.               4,015      5,243          16         25          5         17           8         13
Tex.               29,969     32,833         179        463         18         17          35         32

MOUNTAIN            9,118      9,173         162        387         51         78          18         19
Mont.                  54         50           5          8          -          2           -          -
Idaho                  89        181           8         87          3          3           5          7
Wyo.                   44         36          58        102          -          1           3          1
Colo.               2,386      2,033          23         32         15         20           -          -
N. Mex.               819      1,011           8         97          1          2           1          4
Ariz.               4,278      4,181          46         19          7         21           2          1
Utah                  254        236           6         22         19         21           5          -
Nev.                1,194      1,445           8         20          6          8           2          6

PACIFIC            21,333     23,196         277        963         82         69         166        164
Wash.               2,133      1,948          20         29         17         15          11          7
Oreg.                 870        880          22         21          N          N          14         21
Calif.             17,627     19,531         235        859         64         52         141        135
Alaska                296        331           -          -          1          1           -          1
Hawaii                407        506           -         54          -          1           N          N

Guam                   38         73           1          1          -          2           -          1
P.R.                  337        382           -          -          -          -           N          N
V.I.                    U          U           U          U          U          U           U          U
Amer. Samoa             U          U           U          U          U          U           U          U
C.N.M.I.                U          U           U          U          U          U           U          U

--------------------------------------------------------------------------------------------------------
N: Not notifiable    U: Unavailable    -: no reported cases
=======================================================================================================================================================

TABLE II. (page 3) Provisional cases of selected notifiable diseases, United States, weeks ending
January 1, 2000, and January 2, 1999 (52nd Week)

                                                                            Salmonellosis*
                                                              ------------------------------------------
                        Malaria           Rabies, Animal             NETSS                  PHLIS
                   -----------------   --------------------   -------------------    -------------------
                     Cum.       Cum.        Cum.       Cum.       Cum.       Cum.        Cum.       Cum.
Reporting Area       1999       1998        1999       1998       1999       1998        1999       1998
--------------------------------------------------------------------------------------------------------
UNITED STATES       1,354      1,611       5,844      7,259     38,324     43,694      30,299     33,617

NEW ENGLAND            67         98         884      1,452      2,175      2,508       2,161      2,267
Maine                   3          5         171        241        132        165         104         69
N.H.                    2          6          50         83        136        187         143        216
Vt.                     5          2          92         72         93        144          90        114
Mass.                  24         27         223        498      1,174      1,312       1,191      1,346
R.I.                    5         15          95        103        129        159         173         34
Conn.                  28         43         253        455        511        541         460        488

MID. ATLANTIC         329        426       1,137      1,609      4,876      6,767       4,154      5,723
Upstate N.Y.           73         93         812      1,095      1,426      1,680       1,297      1,365
N.Y. City             170        240           U          U      1,398      1,895       1,216      1,456
N.J.                   48         58         173        224        979      1,476         685      1,386
Pa.                    38         35         152        290      1,073      1,716         956      1,516

E.N. CENTRAL          154        147         146        127      5,361      6,279       3,439      4,865
Ohio                   18         15          36         59      1,320      1,491       1,090      1,139
Ind.                   21         11          13         12        530        685         431        523
Ill.                   61         59          10          N      1,565      1,921         399      1,591
Mich.                  42         50          87         37        940      1,169         938      1,097
Wis.                   12         12           -         19      1,006      1,013         581        515

W.N. CENTRAL           80        110         684        741      2,223      2,361       2,276      2,325
Minn.                  47         71         115        119        633        601         677        656
Iowa                   13          8         162        153        263        375         210        294
Mo.                    15         15          15         42        752        632         904        852
N. Dak.                 -          3         139        155         51         68          61         67
S. Dak.                 -          1         163        166         96        132         118        134
Nebr.                   1          2           3          7        209        190          81         47
Kans.                   4         10          87         99        219        363         225        275

S. ATLANTIC           361        349       2,099      2,350      9,036      9,326       6,183      6,189
Del.                    1          3          43         49        146         79         161        127
Md.                   100         89         395        439        884        931         991        897
D.C.                   18         19           -         10         69         84           U          U
Va.                    73         61         578        549      1,261      1,135         983        878
W. Va.                  4          2         111         77        178        181         150        164
N.C.                   36         30         413        555      1,331      1,309       1,307      1,430
S.C.                   17          6         133        147        698        667         492        544
Ga.                    29         43         241        309      1,640      1,839       1,644      1,576
Fla.                   83         96         185        215      2,829      3,101         455        573

E.S. CENTRAL           27         35         256        278      2,174      2,363       1,154      1,584
Ky.                     7          7          35         32        413         36           -        124
Tenn.                   9         17          95        142        571        624         587        720
Ala.                    7          6         125        102        596        695         490        578
Miss.                   4          5           1          2        594        680          77        162

W.S. CENTRAL           17        101         107         35      3,907      5,381       3,698      3,191
Ark.                    3          2          14         35        642        616         120        380
La.                    11         17           -          -        578        863         602        805
Okla.                   2          4          93          N        455        501         338        236
Tex.                    1         78           -          -      2,232      3,401       2,638      1,770

MOUNTAIN               44         68         198        251      3,098      2,601       2,541      2,029
Mont.                   4          1          59         56         83         79           1         44
Idaho                   3          8           5          N        135        122          98         97
Wyo.                    1          -          45         66         68         70          49         61
Colo.                  17         18           1         42        703        539         710        507
N. Mex.                 2         12           9          6        374        306         245        265
Ariz.                   9         15          66         48        978        885         807        707
Utah                    4          2           8         27        572        355         578        122
Nev.                    4         12           5          6        185        245          53        226

PACIFIC               275        277         333        416      5,474      6,108       4,693      5,444
Wash.                  33         30           -          -        664        703         795        686
Oreg.                  21         17           2          7        409        329         515        349
Calif.                208        217         324        384      4,008      4,724       3,087      4,065
Alaska                  1          4           7         25         55         57          30         38
Hawaii                 12          9           -          -        338        295         266        306

Guam                    -          2           -          -         24         46           U          U
P.R.                    -          1          73         52        476        901           U          U
V.I.                    U          U           U          U          U          U           U          U
Amer. Samoa             U          U           U          U          U          U           U          U
C.N.M.I.                U          U           U          U          U          U           U          U

--------------------------------------------------------------------------------------------------------
N: Not notifiable    U: Unavailable    -: no reported cases

* Individual cases may be reported through both the National Electronic Telecommunications System for Surveillance (NETSS)
  and the Public Health Laboratory Information System (PHLIS).
=======================================================================================================================================================

TABLE II. (page 4) Provisional cases of selected notifiable diseases, United States, weeks ending
January 1, 2000, and January 2, 1999 (52nd Week)

                                  Shigellosis*
                    ---------------------------------------          Syphilis
                         NETSS                  PHLIS          (Primary & Secondary)      Tuberculosis
                    ----------------       ----------------    ---------------------    ------------------
                     Cum.       Cum.        Cum.       Cum.       Cum.       Cum.        Cum.       Cum.
Reporting Area       1999       1998        1999       1998       1999       1998        1999**     1998**
----------------------------------------------------------------------------------------------------------
UNITED STATES      16,015     23,626       7,900     12,432      6,277      7,089      13,996     18,258

NEW ENGLAND           854        413         825        364         60         80         449        477
Maine                   5         14           -          -          -          1          20         13
N.H.                   17         18          17         22          1          2          10          -
Vt.                     7          7           4          5          3          4           2          5
Mass.                 725        266         714        259         37         46         263        282
R.I.                   31         37          28         13          3          1          42         63
Conn.                  69         71          62         65         16         26         112        114

MID. ATLANTIC         982      2,412         481      1,689        199        334       2,539      3,353
Upstate N.Y.          297        678          73        228         23         38         312        442
N.Y. City             300        710         103        589         89         90       1,329      1,558
N.J.                  197        662         155        618         53        107         517        640
Pa.                   188        362         150        254         34         99         381        713

E.N. CENTRAL        3,028      3,037       1,354      1,577      1,186      1,040       1,304      1,747
Ohio                  424        566         143        154         90        134         253        231
Ind.                  337        180         112         43        454        212         137        173
Ill.                1,134      1,573         592      1,305        393        424         537        850
Mich.                 518        279         423          4        249        211         282        384
Wis.                  615        439          84         71          U         59          95        109

W.N. CENTRAL        1,145      1,119         796        622        108        146         477        520
Minn.                 253        331         252        333          9          9         189        161
Iowa                   72         69          51         46          9          5          58         55
Mo.                   676        221         361        136         72        109         171        184
N. Dak.                 3         11           2          3          -          -           6         10
S. Dak.                18         33          10         23          -          1          17         23
Nebr.                  86        372          66         19          8          8          17         31
Kans.                  37         82          54         62         10         14          19         56

S. ATLANTIC         2,473      4,727         503      1,274      1,984      2,593       2,876      3,556
Del.                   13         46           9         38         10         21          12         37
Md.                   161        202          62         69        311        667         267        324
D.C.                   51         37           U          U         60         89          50        105
Va.                   131        200          63         87        153        149         268        339
W. Va.                  9         11           5          8          2          3          41         42
N.C.                  210        372          91        183        439        724         430        498
S.C.                  124        198          62         99        247        313         226        283
Ga.                   242      1,138          85        251        421        333         575        630
Fla.                1,532      2,523         126        539        341        294       1,007      1,298

E.S. CENTRAL        1,173      1,734         527      1,232      1,126      1,210         869      1,239
Ky.                   235        158           -         45        101        103         166        175
Tenn.                 659      1,062         455        960        630        567         333        458
Ala.                  117        459          62        220        205        274         314        381
Miss.                 162         55          10          7        190        266          56        225

W.S. CENTRAL        2,580      5,295       2,446      1,474      1,005      1,069       1,490      2,519
Ark.                   75        211          23         68         79        108         167        171
La.                   179        384         139        288        298        420           U        311
Okla.                 536        712         155        213        186         98         144        191
Tex.                1,790      3,988       2,129        905        442        443       1,179      1,846

MOUNTAIN            1,201      1,323         749        760        235        239         455        617
Mont.                  10          8           -          3          1          -          13         21
Idaho                  29         20          12         15          1          2          15         14
Wyo.                    3          4           1          1          -          1           3          4
Colo.                 207        229         158        164          2         10           U         76
N. Mex.               155        306          94        177         11         22          63         68
Ariz.                 637        643         411        344        212        185         239        254
Utah                   70         48          67         36          2          4          40         52
Nev.                   90         65           6         20          6         15          82        128

PACIFIC             2,579      3,566         219      3,440        374        378       3,537      4,230
Wash.                 134        277          99        192         77         44         190        265
Oreg.                  95        194          90        156         10          6          99        156
Calif.              2,311      3,033           -      3,033        283        323       3,008      3,573
Alaska                  4         11           3          7          1          1          60         55
Hawaii                 35         51          27         52          3          4         180        181

Guam                    8         39           U          U          1          1          11         84
P.R.                  113         69           U          U        159        177          41        201
V.I.                    U          U           U          U          U          U           U          U
Amer. Samoa             U          U           U          U          U          U           U          U
C.N.M.I.                U          U           U          U          U          U           U          U

----------------------------------------------------------------------------------------------------------
N: Not notifiable    U: Unavailable    -: no reported cases

 * Individual cases may be reported through both the National Electronic Telecommunications System for Surveillance (NETSS)
   and the Public Health Laboratory Information System (PHLIS).
** Cumulative reports of provisional tuberculosis cases for 1998 and 1999 are unavailable ('U') for some
   areas using the Tuberculosis Information Management System (TIMS).

=======================================================================================================================================================


Return to top.

Table III
Note: To print large tables and graphs users may have to change their printer settings to landscape and use a small font size.
TABLE III. (page 1) Provisional cases of selected notifiable diseases preventable by vaccination, United
States, weeks ending January 1, 2000, and January 2, 1999 (52nd Week)

                                                Hepatitis (Viral), by type                                    Measles (Rubeola)
                     H. influenzae,       ---------------------------------------        ------------------------------------------------------------
                        invasive                  A                     B                  Indigenous            Imported*                 Total
                    ----------------      -----------------     -----------------        ---------------       ---------------        ---------------
                     Cum.       Cum.        Cum.       Cum.       Cum.       Cum.                   Cum.                  Cum.        Cum.       Cum.
Reporting Area       1999**     1998        1999       1998       1999       1998        1999       1999       1999       1999        1999       1998
-----------------------------------------------------------------------------------------------------------------------------------------------------
UNITED STATES       1,165      1,194      16,919     23,229      6,495     10,258           -         60          1         26          86        100

NEW ENGLAND           102        108         307        299        137        230           -          6          -          5          11          3
Maine                   8          5          14         20          1          5           U          -          U          -           -          -
N.H.                   21         10          18         19         17         21           -          -          -          1           1          -
Vt.                     6          9          24         17          3         10           -          -          -          -           -          1
Mass.                  40         42         122        126         43         81           -          5          -          3           8          2
R.I.                    6          9          26         18         34         75           U          -          U          -           -          -
Conn.                  21         33         103         99         39         38           -          1          -          1           2          -

MID. ATLANTIC         176        196         954      1,726        588      1,249           -          -          -          2           2         16
Upstate N.Y.           81         81         275        376        182        262           -          -          -          2           2          4
N.Y. City              41         50         322        591        209        423           -          -          -          -           -          -
N.J.                   50         53         112        343         41        205           -          -          -          -           -          8
Pa.                     4         12         245        416        156        359           -          -          -          -           -          4

E.N. CENTRAL          176        186       2,837      3,715        682      1,414           -          1          1          3           4         16
Ohio                   62         48         658        398         95         77           -          -          -          -           -          1
Ind.                   25         51         109        174         44        117           -          1          -          1           2          3
Ill.                   74         67         746        821          1        230           -          -          -          -           -          1
Mich.                  14         13       1,254      2,135        517        476           -          -          1          2           2         10
Wis.                    1          7          70        187         25        514           -          -          -          -           -          1

W.N. CENTRAL           89        104       1,109      1,362        400        438           -          1          -          -           1          -
Minn.                  48         77         111        145         59         71           -          1          -          -           1          -
Iowa                    9          5         150        400         41         55           -          -          -          -           -          -
Mo.                    23         12         732        637        252        252           -          -          -          -           -          -
N. Dak.                 1          1           3          4          2          4           U          -          U          -           -          -
S. Dak.                 1          1           9         40          1          4           -          -          -          -           -          -
Nebr.                   3          2          64         27         18         24           -          -          -          -           -          -
Kans.                   4          6          40        109         27         28           U          -          U          -           -          -

S. ATLANTIC           264        224       2,071      2,395      1,246      1,323           -         14          -          6          20          9
Del.                    -          1           2          6          1          4           -          -          -          -           -          1
Md.                    71         57         358        416        170        143           -          -          -          -           -          1
D.C.                    5          -          59         66         24         19           -          -          -          -           -          -
Va.                    23         19         181        226         98        109           -         14          -          4          18          2
W. Va.                  8          7          44          9         23         14           -          -          -          -           -          -
N.C.                   36         24         167        128        224        243           -          -          -          -           -          1
S.C.                    6          3          47         54         64         65           -          -          -          -           -          -
Ga.                    68         69         464        879        186        209           -          -          -          -           -          2
Fla.                   47         44         749        611        456        517           -          -          -          2           2          2

E.S. CENTRAL           67         64         386        416        464        512           -          2          -          -           2          2
Ky.                     8          7          63         32         45         49           -          2          -          -           2          -
Tenn.                  38         38         147        234        207        294           -          -          -          -           -          1
Ala.                   17         16          60         81         78         75           -          -          -          -           -          1
Miss.                   4          3         116         69        134         94           -          -          -          -           -          -

W.S. CENTRAL           61         68       3,832      4,461        917      2,466           -         10          -          4          14          -
Ark.                    2          -          75         82         75        115           -          5          -          -           5          -
La.                    13         29         204        174        167        219           U          -          U          -           -          -
Okla.                  42         36         517        667        147        172           -          -          -          -           -          -
Tex.                    4          3       3,036      3,538        528      1,960           -          5          -          4           9          -

MOUNTAIN              113        127       1,285      3,134        570        813           -          4          -          -           4         11
Mont.                   3          -          17         96         17          8           U          -          U          -           -          -
Idaho                   2          2          48        235         29         49           -          -          -          -           -          -
Wyo.                    1          1           8         37         13         11           -          -          -          -           -          -
Colo.                  12         21         215        345         97        102           -          -          -          -           -          -
N. Mex.                19          8          56        155        185        311           -          -          -          -           -          -
Ariz.                  61         69         744      1,843        144        185           -          1          -          -           1         11
Utah                   11          7          66        196         37         66           -          2          -          -           2          -
Nev.                    4         19         131        227         48         81           U          1          U          -           1          -

PACIFIC               117        117       4,138      5,721      1,491      1,813           -         22          -          6          28         43
Wash.                   7         11         466      1,037         94        136           -          -          -          -           -          1
Oreg.                  40         42         238        435        100        201           U          9          U          -           9          -
Calif.                 50         50       3,401      4,178      1,264      1,445           -         13          -          4          17          9
Alaska                  9          4          12         17         19         13           -          -          -          -           -         33
Hawaii                 11         10          21         54         14         18           -          -          -          2           2          -

Guam                    -          -           2          1          2          2           U          1          U          -           1          -
P.R.                    1          2         236         94        167        276           -          -          -          -           -          -
V.I.                    U          U           U          U          U          U           U          U          U          U           U          U
Amer. Samoa             U          U           U          U          U          U           U          U          U          U           U          U
C.N.M.I.                U          U           U          U          U          U           U          U          U          U           U          U
-----------------------------------------------------------------------------------------------------------------------------------------------------
N: Not notifiable    U: Unavailable     -: no reported cases

 * For imported measles, cases include only those resulting from importation from other countries.
** Of 230 cases among children aged <5 years, serotype was reported for 117 and of those, 33 were type b.
=======================================================================================================================================================

TABLE III. (page 2) Provisional cases of selected notifiable diseases preventable by vaccination, United
States, weeks ending January 1, 2000, and January 2, 1999 (52nd Week)

                     Meningococcal
                        Disease                      Mumps                           Pertussis                          Rubella
                   -----------------        --------------------------       ---------------------------       ---------------------------
                     Cum.       Cum.                   Cum.       Cum.                   Cum.       Cum.                  Cum.        Cum.
Reporting Area       1999       1998        1999       1999       1998       1999        1999       1998       1999       1999        1998
------------------------------------------------------------------------------------------------------------------------------------------
UNITED STATES       2,352      2,725           3        352        666         75       6,031      7,405          -        238         364

NEW ENGLAND           113        123           -          8         10          5         762      1,114          -          7          38
Maine                   5          8           U          -          -          U           -          5          U          -           -
N.H.                   13         13           -          1          -          -          78        149          -          -           -
Vt.                     5          5           -          1          -          2          88         80          -          -           -
Mass.                  66         59           -          4          6          3         527        805          -          7           8
R.I.                    7          8           U          2          1          U          38         21          U          -           1
Conn.                  17         30           -          -          3          -          31         54          -          -          29

MID. ATLANTIC         214        295           -         36        207         11       1,020        695          -         25         150
Upstate N.Y.           71         84           -         14         14          4         807        352          -         21         114
N.Y. City              50         35           -          3        167          -          10         54          -          -          20
N.J.                   49         60           -          -          6          -          12         29          -          1          14
Pa.                    44        116           -         19         20          7         191        260          -          3           2

E.N. CENTRAL          391        399           1         48         82         19         630        919          -          2           2
Ohio                  132        143           1         21         29          5         329        299          -          -           -
Ind.                   70         74           -          5          7          -          77        185          -          1           -
Ill.                  101        104           -         13         10         14         102        173          -          1           1
Mich.                  47         44           -          7         33          -          70         71          -          -           1
Wis.                   41         34           -          2          3          -          52        191          -          -           -

W.N. CENTRAL          248        231           -         14         34          4         446        756          -        127          41
Minn.                  54         37           -          1         13          2         236        439          -          5           -
Iowa                   45         46           -          8         11          2          79         78          -         29           -
Mo.                   103         80           -          1          4          -          65         59          -          3           2
N. Dak.                 4          5           U          1          2          U          18         46          U          -           -
S. Dak.                11          9           -          -          -          -           7          8          -          -           -
Nebr.                  13         17           -          -          -          -           6         21          -         90           -
Kans.                  18         37           U          3          4          U          35        105          U          -          39

S. ATLANTIC           428        482           1         54         57          3         442        380          -         39          22
Del.                    8          2           -          -          -          1           7          5          -          -           -
Md.                    57         35           -          7          -          -         107         66          -          1           1
D.C.                    2          4           -          2          -          -           1          1          -          -           -
Va.                    56         49           -         10         13          -          51         56          -          -           1
W. Va.                  9         19           -          -          -          -           4          7          -          -           -
N.C.                   47         59           -          9         12          2         101        112          -         37          16
S.C.                   46         57           1          6          8          -          29         29          -          -           -
Ga.                    66        102           -          4          2          -          40         38          -          -           -
Fla.                  137        155           -         16         22          -         102         66          -          1           4

E.S. CENTRAL          154        205           -         14         19          -          97        168          -          1           2
Ky.                    34         38           -          -          1          -          29         95          -          -           -
Tenn.                  64         75           -          -          2          -          45         40          -          -           2
Ala.                   32         55           -         11          9          -          21         27          -          1           -
Miss.                  24         37           -          3          7          -           2          6          -          -           -

W.S. CENTRAL          203        338           -         41         67          -         165        427          -         15          90
Ark.                   35         31           -          -         13          -          19         93          -          6           -
La.                    58         69           U         11          8          U          10         13          U          -           1
Okla.                  36         44           -          1          4          -          12         33          -          -           -
Tex.                   74        194           -         29         42          -         124        288          -          9          89

MOUNTAIN              146        157           1         29         40         28         811      1,324          -         17           6
Mont.                   4          5           U          -          -          U           2         17          U          -           -
Idaho                  15         14           1          4          7          1         141        263          -          -           -
Wyo.                    5          8           -          -          1          -           2          8          -          -           -
Colo.                  39         31           -          5          7         24         245        357          -          1           -
N. Mex.                16         26           N          N          N          1         221        100          -          -           1
Ariz.                  43         48           -          8          6          2         128        241          -         13           2
Utah                   16         15           -          7          5          -          61        297          -          2           2
Nev.                    8         10           U          5         14          U          11         41          U          1           1

PACIFIC               455        495           -        108        150          5       1,658      1,622          -          5          13
Wash.                  75         77           -          2         11          5         625        407          -          -           8
Oreg.                  77         91           N          N          N          U          58         89          U          -           -
Calif.                287        319           -         90        110          -         936      1,085          -          5           3
Alaska                  7          3           -          3          3          -           5         15          -          -           -
Hawaii                  9          5           -         13         26          -          34         26          -          -           2

Guam                    2          2           U          1          5          U           1          1          U          -           -
P.R.                    9         11           -          -          7          -          20         10          -          -          14
V.I.                    U          U           U          U          U          U           U          U          U          U           U
Amer. Samoa             U          U           U          U          U          U           U          U          U          U           U
C.N.M.I.                U          U           U          U          U          U           U          U          U          U           U

------------------------------------------------------------------------------------------------------------------------------------------
N: Not notifiable    U: Unavailable     -: no reported cases

=======================================================================================================================================================


Return to top.

Table IV
Note: To print large tables and graphs users may have to change their printer settings to landscape and use a small font size.
TABLE IV. Deaths in 122 U.S. cities,* week ending
January 1, 2000 (52nd Week)
===================================================================================================================================
                                                 All Causes, By Age (Years)
                          ------------------------------------------------------------------------        P&I**
Reporting Area            All Ages         >=65        45-64       25-44         1-24           <1        Total
---------------------------------------------------------------------------------------------------------------
NEW ENGLAND                    643          467          109          44           13           10           52
Boston, Mass.                  160          106           39          10            5            -           14
Bridgeport, Conn.               49           37            5           4            3            -            1
Cambridge, Mass.                13           13            -           -            -            -            -
Fall River, Mass.               24           21            1           1            1            -            1
Hartford, Conn.                 54           34           14           6            -            -            8
Lowell, Mass.                   33           25            3           4            1            -            4
Lynn, Mass.                     11           10            -           1            -            -            1
New Bedford, Mass.              26           20            3           2            1            -            2
New Haven, Conn.                34           16           11           2            2            3            3
Providence, R.I.                79           63           13           2            -            1            5
Somerville, Mass.                8            6            -           2            -            -            -
Springfield, Mass.              59           42            9           4            -            4            4
Waterbury, Conn.                10            9            1           -            -            -            1
Worcester, Mass.                83           65           10           6            -            2            8

MID. ATLANTIC                2,144        1,530          405         146           30           32           80
Albany, N.Y.                    71           50            9           5            3            4            3
Allentown, Pa.                   U            U            U           U            U            U            U
Buffalo, N.Y.                  112           85           19           6            1            1            7
Camden, N.J.                    31           22            5           3            -            1            1
Elizabeth, N.J.                 10            8            1           -            -            1            -
Erie, Pa.***                    37           30            6           -            1            -            1
Jersey City, N.J.               63           45            9           7            1            1            -
New York City, N.Y.          1,226          876          232          92           13           12           30
Newark, N.J.                     U            U            U           U            U            U            U
Paterson, N.J.                  21           15            5           1            -            -            1
Philadelphia, Pa.              195          116           44          25            6            4            8
Pittsburgh, Pa.***              47           32           11           3            1            -            6
Reading, Pa.                    29           23            3           -            1            2            1
Rochester, N.Y.                110           83           23           1            2            1            7
Schenectady, N.Y.               30           25            4           -            1            -            1
Scranton, Pa.***                40           29           10           1            -            -            1
Syracuse, N.Y.                  66           49           14           -            -            3            7
Trenton, N.J.                   30           20            6           2            -            2            4
Utica, N.Y.                     26           22            4           -            -            -            2
Yonkers, N.Y.                    U            U            U           U            U            U            U

E.N. CENTRAL                 2,080        1,465          377         140           49           47          174
Akron, Ohio                     43           35            5           -            -            3            8
Canton, Ohio                    35           27            8           -            -            -            2
Chicago, Ill.                  407          252           85          38           14           16           37
Cincinnati, Ohio               137          106           17           9            4            1           19
Cleveland, Ohio                106           73           27           2            2            2            3
Columbus, Ohio                 159          119           29           7            3            1            9
Dayton, Ohio                   111           83           18           6            3            1            9
Detroit, Mich.                 208          121           54          24            2            7           13
Evansville, Ind.                38           28            4           5            -            1            1
Fort Wayne, Ind.                60           47            9           3            1            -            3
Gary, Ind.                       5            3            1           1            -            -            -
Grand Rapids, Mich.            111           81           18           3            4            5           14
Indianapolis, Ind.             191          134           38          12            3            4            9
Lansing, Mich.                  34           28            4           2            -            -            2
Milwaukee, Wis.                 94           75           10           5            3            1           15
Peoria, Ill.                    45           33            8           2            2            -            5
Rockford, Ill.                  93           66           13           8            3            3           11
South Bend, Ind.                41           28            7           4            1            1            3
Toledo, Ohio                    95           74           12           5            3            1            7
Youngstown, Ohio                67           52           10           4            1            -            4

W.N. CENTRAL                   644          485          108          31            6           14           44
Des Moines, Iowa                 U            U            U           U            U            U            U
Duluth, Minn.                   26           21            4           1            -            -            1
Kansas City, Kans.              22           17            3           1            1            -            1
Kansas City, Mo.               106           67           26           6            3            4            4
Lincoln, Nebr.                  39           32            6           1            -            -            3
Minneapolis, Minn.             112           92            9           7            1            3            8
Omaha, Nebr.                    98           78           17           1            1            1           13
St. Louis, Mo.                  84           60           16           4            -            4            -
St. Paul, Minn.                 85           67           12           5            -            1            9
Wichita, Kans.                  72           51           15           5            -            1            5
S. ATLANTIC                    896          573          199          78           28           18           82
Atlanta, Ga.                     U            U            U           U            U            U            U
Baltimore, Md.                 180          111           43          14            8            4           16
Charlotte, N.C.                104           76           16           7            1            4           10
Jacksonville, Fla.              96           58           22          13            3            -           12
Miami, Fla.                    105           68           24          11            1            1            8
Norfolk, Va.                    47           31            8           8            -            -            5
Richmond, Va.                   59           35           13           7            2            2            7
Savannah, Ga.                   33           23            5           4            1            -            4
St. Petersburg, Fla.             U            U            U           U            U            U            U
Tampa, Fla.                    151          110           27           9            5            -           15
Washington, D.C.               101           53           29           5            7            7            5
Wilmington, Del.                20            8           12           -            -            -            -

E.S. CENTRAL                   670          462          139          40           15           13           70
Birmingham, Ala.               129           86           32           6            2            2           22
Chattanooga, Tenn.              61           43           14           4            -            -            6
Knoxville, Tenn.                64           48           10           3            2            1            5
Lexington, Ky.                  83           58           17           3            4            1           13
Memphis, Tenn.                 115           75           21          10            4            5            9
Mobile, Ala.                    57           42           12           2            -            1            4
Montgomery, Ala.                39           27            7           2            3            -            5
Nashville, Tenn.               122           83           26          10            -            3            6

W.S. CENTRAL                 1,369          925          276         101           39           28          109
Austin, Tex.                    82           60           15           6            1            -            9
Baton Rouge, La.                63           50            6           3            3            1            -
Corpus Christi, Tex.            53           30           15           3            2            3            4
Dallas, Tex.                   174          106           38          14           10            6            5
El Paso, Tex.                   57           39            8           7            3            -            3
Ft. Worth, Tex.                112           87           19           4            2            -           18
Houston, Tex.                  300          199           66          24            4            7           22
Little Rock, Ark.               78           45           18           8            5            2            5
New Orleans, La.                63           40           16           4            3            -            8
San Antonio, Tex.              229          160           47          12            4            6           23
Shreveport, La.                 65           48            9           3            2            3            8
Tulsa, Okla.                    93           61           19          13            -            -            4

MOUNTAIN                       952          691          160          63           17           21          122
Albuquerque, N.M.              109           83           17           6            -            3           11
Boise, Idaho                    43           34            6           2            -            1            9
Colo. Springs, Colo.             U            U            U           U            U            U            U
Denver, Colo.                  111           76           19          11            2            3            7
Las Vegas, Nev.                167          118           35          11            1            2           18
Ogden, Utah                      6           37            6           3            -            -            7
Phoenix, Ariz.                 183          112           33          21            8            9           28
Pueblo, Colo.                   38           30            5           2            1            -            8
Salt Lake City, Utah           101           75           18           1            4            3           12
Tucson, Ariz.                  154          126           21           6            1            -           22

PACIFIC                      1,311          964          231          76           21           16          166
Berkeley, Calif.                17           12            4           -            -            1            4
Fresno, Calif.                  63           48           10           4            1            -           10
Glendale, Calif.                 3            -            2           -            1            -            -
Honolulu, Hawaii                67           50           10           5            1            1            9
Long Beach, Calif.              85           57           22           -            5            1           17
Los Angeles, Calif.            127           81           32          10            3            1            6
Pasadena, Calif.                28           22            4           1            -            1           12
Portland, Oreg.                121           92           16          10            -            3            9
Sacramento, Calif.             120          101           14           4            -            1           16
San Diego, Calif.              158          119           27           7            3            2           19
San Francisco, Calif.            U            U            U           U            U            U            U
San  Jose, Calif.              195          154           26          12            1            2           29
Santa Cruz, Calif.              17           13            3           1            -            -            5
Seattle, Wash.                 108           68           26          13            1            -            6
Spokane, Wash.                  77           57           13           4            1            2           13
Tacoma, Wash.                  125           90           22           5            4            1           11

TOTAL                   10,709****        7,562        2,004         719          218          199          899

---------------------------------------------------------------------------------------------------------------
U: Unavailable    -: no reported cases

   * Mortality data in this table are voluntarily reported from 122 cities in the United States, most of which have populations
     of 100,000 or more. A death is reported by the place of its occurrence and by the week that the death certificate was
     filed. Fetal deaths are not included.
  ** Pneumonia and influenza.
 *** Because of changes in reporting methods in this Pennsylvania city, these numbers are partial counts for the current
     week. Complete counts will be available in 4 to 6 weeks.
**** Total includes unknown ages.
===================================================================================================================================


Return to top.

Disclaimer   All MMWR HTML versions of articles are electronic conversions from ASCII text into HTML. This conversion may have resulted in character translation or format errors in the HTML version. Users should not rely on this HTML document, but are referred to the electronic PDF version and/or the original MMWR paper copy for the official text, figures, and tables. An original paper copy of this issue can be obtained from the Superintendent of Documents, U.S. Government Printing Office (GPO), Washington, DC 20402-9371; telephone: (202) 512-1800. Contact GPO for current prices.

**Questions or messages regarding errors in formatting should be addressed to mmwrq@cdc.gov.

Page converted: 01/06/00

HOME  |  ABOUT MMWR  |  MMWR SEARCH  |  DOWNLOADS  |  RSSCONTACT
POLICY  |  DISCLAIMER  |  ACCESSIBILITY

Safer, Healthier People

Morbidity and Mortality Weekly Report
Centers for Disease Control and Prevention
1600 Clifton Rd, MailStop E-90, Atlanta, GA 30333, U.S.A

USA.GovDHHS

Department of Health
and Human Services

This page last reviewed 5/2/01