 |
|
|
|
|
|
|
| ||||||||||
|
|
|
|
|
|
|
||||
| ||||||||||
|
|
|
|
|
Persons using assistive technology might not be able to fully access information in this file. For assistance, please send e-mail to: mmwrq@cdc.gov. Type 508 Accommodation and the title of the report in the subject line of e-mail. Evaluating Newborn Screening Program Data Systems -- Georgia, 1998All 50 states and the District of Columbia conduct newborn screening (NBS) programs that annually screen approximately 4 million infants for metabolic and other disorders to prevent mental retardation, disability, and death (1,2). In 1998, Georgia newborns were screened for eight disorders: phenylketonuria, galactosemia, tyrosinemia, homocystinuria, hypothyroidism, maple syrup urine disease, congenital adrenal hyperplasia, and sickle cell disease (3). Appropriate data that reflect progress toward achieving short- and long-term goals are necessary to assess the effectiveness of NBS and to inform public health policy decisions about which disorders to add or delete from screening. This report summarizes findings from an evaluation of data systems for metabolic and endocrine disorders in the Georgia NBS program and assesses the ability to measure progress toward short- and long-term goals. Although the data indicate that the program typically received specimens of sufficient quality for testing in a timely manner, additional data are needed to assess fully the effectiveness of the NBS program in identifying disorders. The Georgia NBS data system includes the Georgia NBS laboratory and the Emory University Medical Genetics databases. The NBS laboratory database is a computerized database of each blood specimen received and tested by the laboratory. Information from the blood specimen collection forms and results of each test were entered by specimen. Collection form data included demographics, specimen quality (adequate or inadequate), reason if the specimen is inadequate, and confounders of test results (e.g., antibiotic use and transfusions). Data from the NBS laboratory on specimens initially screening positive for any of the eight disorders were transmitted electronically to and included in the Emory University Medical Genetics database. In the Emory database, test results were consolidated by child. Data on each child included the same demographic data in the NBS laboratory database, follow-up test results, final diagnosis (or confirmation of false-positive results), and initial treatment or referral received. All specimens received by the NBS laboratory in 1998 and entered into the database were included in this analysis. During 1998, the NBS laboratory received 199,387* specimens. Of these specimens, 135,163 (67.8%) were collected satisfactorily and were received within 1 week of the infant's birth, which is the appropriate time; 20,839 (10.4%) specimens were collected satisfactorily, but received 1 week after the infant's birth; 20,691 (10.4%) specimens were collected from low birthweight newborns (less than 5 lbs, 8 oz [less than 2500 g]); and 20,687 (10.4%) specimens were classified as unsatisfactory. The remaining 1% of specimens were labeled "requested repeat" and were specimens from known cases. Of the 199,387 specimens collected, 4557 (2%) had initially abnormal screening results. From these abnormal screening results, Emory University Medical Genetics completed follow-up for 4364. The 42 results with incomplete follow-up included tests on 33 newborns lost to follow-up, tests on five newborns whose parents or physician refused further testing, and tests on four newborns who moved out of state. Repeat testing of specimens with initial abnormal results produced 4094 final normal results. The 4557 initially abnormal screening results represented 4466 infants who were examined at the Emory University Medical Genetics program and represented in the database. Clinically significant disorders (those requiring continued medical intervention) were diagnosed in 93 of the infants, and 100 additional infants needed transitory treatment and/or whose parents needed genetic counseling information. All those diagnosed with a clinically significant disorder obtained their first abnormal test result within 1 week of birth. Treatments were initiated from age 1 week to age 2 months (4). Data unavailable from the system included the number of children the 199,387 specimens represent and long-term follow-up outcomes on the 93 children with clinically significant disorders diagnosed. In the system, no mechanism exists for systematic long-term follow-up of these or children with previously diagnosed disorders. Records of morbidity (e.g., hospitalizations, disability, diagnosis of mental retardation, and mortality records) are not included in either NBS database. Reported by: PM Fernhoff, MD, K Grinzaid, MS, Div of Medical Genetics, Dept of Pediatrics, Emory Univ School of Medicine, Atlanta; M Ramachandran, PhD, EA Franko, DrPH, Georgia Public Health Laboratory, Atlanta; M Henson, Genetics Program, Child and Adolescent Health Unit, Div of Public Health, Georgia Dept of Human Resources. Office of Genetics and Disease Prevention, National Center for Environmental Health; and an EIS Officer, CDC. Editorial Note:Information collected on newborns screened in Georgia includes short-term outcomes; specimen quality and timeliness of the screening, diagnosis, and initiation of treatment all are documented. Although these data help to evaluate program performance, other key short-term measures were not available from the data collected. For example, screening coverage (percentage of infants adequately screened) cannot be calculated, and children missed by the program cannot be identified. Comparing the Georgia NBS program with other state programs is difficult because each state conducts its program independently; each state screens for different disorders, and some define each disorder differently (e.g., different laboratory definitions/cut-offs). For the Georgia NBS program, additional data would help to ensure optimal screening coverage and prevent adverse outcomes. Recent technologic advances are leading to an increasing number of disorders that can be screened in NBS programs. The ability of NBS programs to adequately assess the effectiveness of their programs would help states make data-based policy decisions on which disorders to include and which to remove. To facilitate evaluations of NBS programs, short-term and long-term performance measures should be collected. Key short-term measures for NBS programs include the percentage of live-born infants screened in the state, the percentage of live-born infants adequately screened, and the timeliness of diagnoses and treatment. Essential long-term measures should assess whether infants with a diagnosed disorder have developmental disabilities, mental retardation, and premature mortality (5,6) (as measured by hospitalization records to assess burden of illness), and should identify adverse health outcomes associated with each disorder beyond the newborn period. Using the Georgia NBS program as a model, one method to obtain additional data is through database linkage (Figure 1). To calculate screening coverage (and identify children missed), the number of infants screened in Georgia and the number of live births in Georgia are needed. These data could be created by linking the Georgia laboratory database to the Georgia vital records department that handles all birth certificates and infant death files; with the information from these records, the percentage of infants adequately screened could be calculated. This linkage also could assess characteristics of infants missed, allowing development of methods for optimizing screening coverage. Long-term follow-up on children screened and with a diagnosed disorder can be obtained in several ways. First, the Georgia Hospital Association maintains a statewide hospital discharge database; links to the NBS laboratory or Emory University Medical Genetics databases with the hospital discharge database would allow data on hospitalizations of diagnosed children and possible identification of false negatives to be generated. Second, follow-up information such as treatment, compliance, and disease progression for children with a diagnosed disorder could be obtained from treatment center records. Finally, the Georgia vital records department could provide information on mortality of all newborns screened, all newborns with a diagnosed disorder, and the reason for death. A "data warehouse" concept, where databases report their respective data to a central external location for data linkage, also may be useful for the Georgia NBS program. This concept has been discussed for programs relying on coordinated efforts using data systems and eliminates the need for statewide overhaul of computer systems. Linking databases (birth certificates, NBS test results, hospitalizations, clinic visits, and death certificates) would allow unique follow-up of diagnosed disorders in children. To evaluate program performance, CDC is conducting several studies using short and long-term measures to assess effectiveness of NBS for specific disorders. References
* The Georgia NBS laboratory tests all specimens received by the laboratory, including unsatisfactory specimens. Figure 1 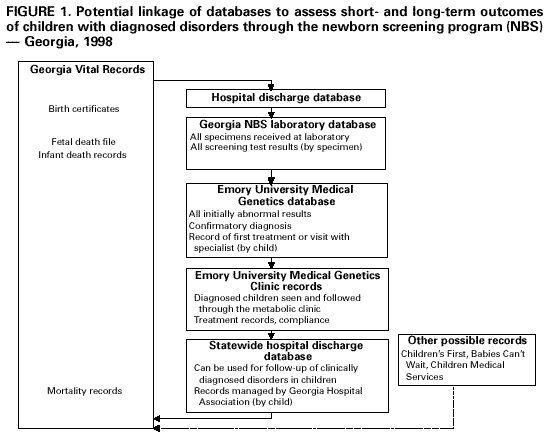 Return to top. Disclaimer All MMWR HTML versions of articles are electronic conversions from ASCII text into HTML. This conversion may have resulted in character translation or format errors in the HTML version. Users should not rely on this HTML document, but are referred to the electronic PDF version and/or the original MMWR paper copy for the official text, figures, and tables. An original paper copy of this issue can be obtained from the Superintendent of Documents, U.S. Government Printing Office (GPO), Washington, DC 20402-9371; telephone: (202) 512-1800. Contact GPO for current prices. **Questions or messages regarding errors in formatting should be addressed to mmwrq@cdc.gov.Page converted: 12/9/1999 |
|||||||||
This page last reviewed 5/2/01
|