Skip Navigation LinksSkip Navigation Links
Centers for Disease Control and Prevention
Safer Healthier People
Blue White
Blue White
bottom curve
CDC Home Search Health Topics A-Z spacer spacer
spacer
Blue curve MMWR spacer
spacer
spacer

Notifiable Diseases/Deaths in Selected Cities Weekly Information

Figure I   Selected notifiable disease reports, comparison of provisional 4-week totals ending November 6, 1999, with historical data -- United States

Table I   Summary -- provisional cases of selected notifiable diseases, United States, cumulative, week ending November 6, 1999 (44th Week)

Table II   Provisional cases of selected notifiable diseases, United States, weeks ending November 6, 1999 and November 7, 1998 (44th Week)

Table III   Provisional cases of selected notifiable diseases preventable by vaccination, United States, weeks ending November 6, 1999 and November 7, 1998 (44th Week)

Table IV   Deaths in 122 U.S. cities, week ending November 6, 1999 (44th Week)


Figure I

Figure I
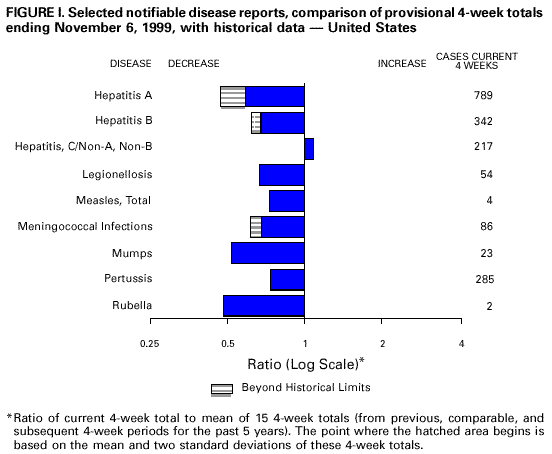
Return to top.

Table I
Note: To print large tables and graphs users may have to change their printer settings to landscape and use a small font size.
TABLE I. Summary -- provisional cases of selected notifiable diseases, United
States, cumulative, week ending November 6, 1999 (44th Week)
==================================================================================
                                             Cum. 1999
------------------------------------------------------
Anthrax                                              -
Brucellosis*                                        42
Cholera                                              3
Congenital rubella syndrome                          5
Cyclosporiasis*                                     49
Diphtheria                                           2
Encephalitis:  California*                          50
               eastern equine*                       6
               St. Louis*                            6
               western equine*                       -
Ehrlichiosis   human granulocytic (HGE)*           128
               human monocytic (HME)*               35
Hansen Disease*                                     87
Hantavirus pulmonary syndrome*+                     18
Hemolytic uremic syndrome, post-diarrheal*          88
HIV infection, pediatric*&                         121
Plague                                               5
Poliomyelitis, paralytic                             -
Psittacosis*                                        15
Rabies, human                                        -
Rocky Mountain spotted fever (RMSF)                465
Streptococcal disease, invasive Group A          1,790
Streptococcal toxic-shock syndrome*                 31
Syphilis, congenital@                              175
Tetanus                                             27
Toxic-shock syndrome                                98
Trichinosis                                          8
Typhoid fever                                      261
Yellow fever                                         -
------------------------------------------------------
-: no reported cases
 * Not notifiable in all states
 + Updated weekly from reports to the Division of Viral and Rickettsial
   Diseases, National Center for Infectious Diseases (NCID).
 & Updated monthly from reports to the Division of HIV/AIDS Prevention --
   Surveillance and Epidemiology, National Center for HIV, STD, and TB
   Prevention (NCHSTP), last update October 24, 1999.
 @ Updated from reports to the Division of STD Prevention, NCHSTP.

==================================================================================


Return to top.

Table II
Note: To print large tables and graphs users may have to change their printer settings to landscape and use a small font size.
TABLE II. (page 1) Provisional cases of selected notifiable diseases, United States, weeks ending
November 6, 1999, and November 7, 1998 (44th Week)

                                                                                                    Escherichia
                                                                                                   coli O157:H7*
                                                                                     -----------------------------------------
                          AIDS              Chlamydia          Cryptosporidiosis            NETSS                  PHLIS
                   -----------------   --------------------   -------------------    -------------------      ----------------
                     Cum.       Cum.        Cum.       Cum.       Cum.       Cum.        Cum.       Cum.       Cum.       Cum.
Reporting Area       1999**     1998        1999       1998       1999       1999        1999       1998       1999       1998
------------------------------------------------------------------------------------------------------------------------------
UNITED STATES      37,420     38,690     505,533    500,295      1,987      3,356       2,877      2,575      1,936      1,977

NEW ENGLAND         1,904      1,517      16,989     17,174        129        142         286        292        293        248
Maine                  68         26         738        894         25         29          35         33          -          -
N.H.                   38         25         809        836         17         14          28         42         29         42
Vt.                    15         18         414        357         34         26          32         19         18         17
Mass.               1,231        766       7,808      7,099         49         66         164        135        171        141
R.I.                   90        110       1,974      1,944          4          7          27         11          6          1
Conn.                 462        572       5,246      6,044          -          -           U         52         69         47

MID. ATLANTIC       9,663     10,367      52,184     52,034        370        506         249        267         76         84
Upstate N.Y.        1,146      1,250           N          N        144        304         190        190          -          -
N.Y. City           5,100      5,843      21,963     22,404        114        180           9         12         15         12
N.J.                1,741      1,894       8,990     10,051         36         22          50         65         32         51
Pa.                 1,676      1,380      21,231     19,579         76          N           N          N         29         21

E.N. CENTRAL        2,519      2,736      76,100     84,807        451        676         606        405        425        322
Ohio                  403        567      19,151     22,939         56         68         199        108        168         62
Ind.                  285        446       9,299      9,405         37         52          91         91         55         47
Ill.                1,201      1,037      29,105     22,783         60         80         205        104         81         74
Mich.                 504        530      18,545     17,813         45         37         111        102         73         62
Wis.                  126        156           U     11,867        253        439           N          N         48         77

W.N. CENTRAL          846        750      28,087     29,702        191        304         549        435        370        377
Minn.                 161        146       5,758      5,999         71        125         219        183        158        197
Iowa                   72         60       3,864      3,824         53         63         108         89         70         58
Mo.                   408        363       9,298     10,640         27         25          51         44         57         60
N. Dak.                 6          5         707        876         18         30          16         10         14         15
S. Dak.                13         15       1,337      1,325          7         20          44         30         59         34
Nebr.                  61         60       2,897      2,384         14         35          90         47          -          -
Kans.                 125        101       4,226      4,654          1          6          21         32         12         13

S. ATLANTIC        10,275     10,032     108,441     96,421        331        302         295        218        148        161
Del.                  147        122       2,280      2,213          -          3           6          -          3          2
Md.                 1,242      1,394       9,922      6,307         17         18          36         39          2         14
D.C.                  496        750           N          N          8         21           -          1          U          U
Va.                   689        771      12,367     11,306         21         20          68          N         52         51
W. Va.                 61         70       1,204      2,056          3          1          10          9          8          9
N.C.                  688        703      18,914     18,723         22          N          64         52         49         47
S.C.                  847        638      10,284     14,264          -          -          19         11         14         11
Ga.                 1,466      1,060      29,077     20,362        121        104          29         69          -          -
Fla.                4,639      4,524      24,393     21,190        139        135          63         37         20         27

E.S. CENTRAL        1,666      1,596      38,629     34,842         26         24         113        109         56         62
Ky.                   236        248       6,396      5,450          6         10          43         33          -          -
Tenn.                 643        590      11,791     11,645          6          8          43         49         36         40
Ala.                  423        417      10,761      8,651         11          N          22         21         16         18
Miss.                 364        341       9,681      9,096          3          6           5          6          4          4

W.S. CENTRAL        3,822      4,742      70,980     76,195         80        894         123         88        109         96
Ark.                  158        177       5,075      3,257          1          6          13         11          8         10
La.                   742        814      10,879     12,687         22         15           9          5         13          7
Okla.                 113        254       6,790      8,217         10          N          28         15         24          8
Tex.                2,809      3,497      48,236     52,034         47        873          73         57         64         71

MOUNTAIN            1,469      1,359      26,692     27,565         87        119         288        335        167        235
Mont.                  11         26       1,287      1,152         10         10          24         15          -          5
Idaho                  21         27       1,428      1,695          7         17          56         38         20         24
Wyo.                   10          3         653        599          1          2          14         53         14         55
Colo.                 271        254       5,099      6,581         12         17         106         72         86         61
N. Mex.                78        188       3,151      3,114         38         46          11         18          5         19
Ariz.                 745        550      10,697      9,820         12         18          30         43         19         26
Utah                  129        114       1,808      1,823          N          N          32         72         21         21
Nev.                  204        197       2,569      2,781          7          9          15         24          2         24

PACIFIC             5,256      5,591      87,431     81,555        322        389         368        426        292        392
Wash.                 305        369      10,116      9,523          N          N         144         94        119        124
Oreg.                 185        146       5,072      4,796         88         65          73        102         68         95
Calif.              4,673      4,915      68,196     63,468        234        321         141        223         94        159
Alaska                 13         17       1,611      1,599          -          -           1          7          1          -
Hawaii                 80        144       2,436      2,169          -          3           9          -         10         14

Guam                    5          1         302        355          -          -           N          N          U          U
P.R.                1,094      1,498           U          U          -          N           5          5          U          U
V.I.                   36         31           U          U          U          U           U          U          U          U
Amer. Samoa             -          -           U          U          U          U           U          U          U          U
C.N.M.I.                -          -           U          U          U          U           U          U          U          U
------------------------------------------------------------------------------------------------------------------------------
N: Not notifiable    U: Unavailable    -: no reported cases    C.N.M.I.: Commonwealth of North Mariana Islands

 * Individual cases may be reported through both the National Electronic Telecommunications System for Surveillance (NETSS)
   and the Public Health Laboratory Information System (PHLIS).
** Updated monthly from reports to the Division of HIV/AIDS Prevention -- Surveillance and Epidemiology, National Center for HIV,
   STD, and TB Prevention, last update October 24, 1999.

=======================================================================================================================================================

TABLE II. (page 2) Provisional cases of selected notifiable diseases, United States, weeks ending
November 6, 1999, and November 7, 1998 (44th Week)

                                            Hepatitis                                       Lyme
                       Gonorrhea             C/NA,NB             Legionellosis             Disease
                   -----------------   --------------------   -------------------    -------------------
                     Cum.       Cum.        Cum.       Cum.       Cum.       Cum.        Cum.       Cum.
Reporting Area       1999       1998        1999       1998       1999       1998        1999       1998
--------------------------------------------------------------------------------------------------------
UNITED STATES     282,710    298,684       2,868      2,816        778      1,107      11,143     14,034

NEW ENGLAND         5,214      5,132          59         55         70         76       3,245      4,327
Maine                  42         57           2          -          3          1          41         73
N.H.                   92         79           -          -          6          7          16         42
Vt.                    41         33           6          5         13          7          20         11
Mass.               2,167      1,920          48         47         28         31       1,033        666
R.I.                  496        327           3          3          9         19         450        571
Conn.               2,376      2,716           -          -         11         11       1,685      2,964

MID. ATLANTIC      33,170     32,371         116        188        165        273       6,303      7,743
Upstate N.Y.        5,751      6,135          81         97         53         86       3,390      3,567
N.Y. City          11,762     10,115           -          -          9         34          30        218
N.J.                5,408      6,775           -          U         18         15         905      1,701
Pa.                10,249      9,346          35         91         85        138       1,978      2,257

E.N. CENTRAL       55,411     58,589       1,377        595        218        365         105        709
Ohio               11,535     15,051           3          7         65        114          68         42
Ind.                5,136      5,557           1          5         36         62          19         34
Ill.               25,722     18,930          39         38         22         48          12         14
Mich.              13,018     13,659         743        412         59         76           1         12
Wis.                    U      5,392         591        133         36         65           5        607

W.N. CENTRAL       11,211     14,561         260         36         42         60         205        196
Minn.               2,211      2,302           9          9          9          6         137        148
Iowa                1,027      1,306           -          8         11          9          19         24
Mo.                 4,686      7,499         240         12         14         16          26         11
N. Dak.                71         72           -          -          1          -           1          -
S. Dak.               160        195           -          -          3          3           -          -
Nebr.               1,230      1,007           5          4          4         18          10          3
Kans.               1,826      2,180           6          3          -          8          12         10

S. ATLANTIC        81,311     80,563         181         92        113        124       1,010        790
Del.                1,415      1,291           1          -         11         12          51         63
Md.                 8,575      8,187          38         13         26         31         716        563
D.C.                3,166      3,725           1          -          3          6           4          4
Va.                 8,206      7,685          10         11         28         18         109         59
W. Va.                363        749          17          6          N          N          16         12
N.C.               16,786     16,192          33         19         14         11          66         50
S.C.                5,840      9,146          22          7          8         10           5          6
Ga.                19,795     17,234           1          9          1          8           -          5
Fla.               17,165     16,354          58         27         22         28          43         28

E.S. CENTRAL       31,009     33,698         213        251         36         59          71         98
Ky.                 2,901      3,183          17         19         18         26           9         25
Tenn.               9,569     10,169          79        149         14         21          30         41
Ala.                9,691     11,131           1          4          4          5          19         19
Miss.               8,848      9,215         116         79          -          7          13         13

W.S. CENTRAL       39,702     46,691         290        484         23         30          43         19
Ark.                2,669      3,318          18         21          -          1           4          6
La.                 8,653     10,860         102         95          2          4           -          4
Okla.               3,354      4,488          14         14          3         12           4          2
Tex.               25,026     28,025         156        354         18         13          35          7

MOUNTAIN            7,922      7,692         126        341         41         65          16         17
Mont.                  45         37           5          7          -          2           -          -
Idaho                  71        145           7         86          2          2           5          5
Wyo.                   27         29          37         86          -          1           3          1
Colo.               2,032      1,744          20         27         11         15           -          -
N. Mex.               632        762           8         84          1          2           1          4
Ariz.               3,858      3,553          35         11          6         16           -          1
Utah                  181        192           6         21         15         21           5          -
Nev.                1,076      1,230           8         19          6          6           2          6

PACIFIC            17,760     19,387         246        774         70         55         145        135
Wash.               1,787      1,686          16         21         13         12          10          7
Oreg.                 734        689          17         18          N          N          11         20
Calif.             14,630     16,306         213        681         56         41         124        107
Alaska                260        265           -          -          1          1           -          1
Hawaii                349        441           -         54          -          1           N          N

Guam                   39         61           1          1          -          2           -          1
P.R.                  282        327           -          -          -          -           N          N
V.I.                    U          U           U          U          U          U           U          U
Amer. Samoa             U          U           U          U          U          U           U          U
C.N.M.I.                U          U           U          U          U          U           U          U

--------------------------------------------------------------------------------------------------------
N: Not notifiable    U: Unavailable    -: no reported cases
=======================================================================================================================================================

TABLE II. (page 3) Provisional cases of selected notifiable diseases, United States, weeks ending
November 6, 1999, and November 7, 1998 (44th Week)

                                                                            Salmonellosis*
                                                              ------------------------------------------
                        Malaria           Rabies, Animal             NETSS                  PHLIS
                   -----------------   --------------------   -------------------    -------------------
                     Cum.       Cum.        Cum.       Cum.       Cum.       Cum.        Cum.       Cum.
Reporting Area       1999       1998        1999       1998       1999       1998        1999       1998
--------------------------------------------------------------------------------------------------------
UNITED STATES       1,106      1,265       5,181      6,412     31,605     36,258      24,551     29,849

NEW ENGLAND            58         55         766      1,281      1,427      2,162       1,813      2,046
Maine                   3          5         150        208        122        150          90         58
N.H.                    2          5          48         74        113        170         121        204
Vt.                     4          1          86         59         83        123          73         97
Mass.                  21         17         185        453        989      1,177         993      1,211
R.I.                    4          9          84         85        120        127         147         34
Conn.                  24         18         213        402          U        415         389        442

MID. ATLANTIC         257        376         983      1,401      3,721      5,793       3,244      5,200
Upstate N.Y.           64         83         701        974      1,146      1,405         900      1,238
N.Y. City             115        212           U          U      1,163      1,705         853      1,323
N.J.                   43         51         155        195        508      1,283         535      1,218
Pa.                    35         30         127        232        904      1,400         956      1,421

E.N. CENTRAL          127        131         141        119      4,643      5,536       2,986      4,234
Ohio                   18         14          33         54      1,138      1,337         913      1,013
Ind.                   18         10          12         11        454        589         355        464
Ill.                   46         53          10          N      1,425      1,698         399      1,354
Mich.                  37         43          83         35        858      1,022         841        944
Wis.                    8         11           3         19        768        890         478        459

W.N. CENTRAL           63         85         630        631      1,983      2,022       1,952      2,074
Minn.                  33         51         101        105        576        497         608        582
Iowa                   13          7         147        136        237        338         195        265
Mo.                    13         14          14         37        646        545         792        752
N. Dak.                 -          2         127        122         41         56          48         67
S. Dak.                 -          -         151        147         85        101         106        113
Nebr.                   -          1           3          7        179        166           -         42
Kans.                   4         10          87         77        219        319         203        253

S. ATLANTIC           302        260       1,852      2,100      7,496      7,319       4,599      5,397
Del.                    1          3          37         43        123         70         144        108
Md.                    84         76         349        404        775        811         827        794
D.C.                   17         16           -          -         65         64           U          U
Va.                    63         52         497        500      1,129        964         872        784
W. Va.                  2          2          94         69        138        131         137        146
N.C.                   26         25         371        517      1,158      1,058       1,173      1,242
S.C.                   17          6         132        134        590        566         418        480
Ga.                    21         33         204        261      1,258      1,442         651      1,342
Fla.                   71         47         168        172      2,260      2,213         377        501

E.S. CENTRAL           21         31         229        247      1,645      2,002         924      1,404
Ky.                     7          7          34         29        359        324           -        124
Tenn.                   6         15          82        126        317        519         473        619
Ala.                    7          6         112         90        536        608         374        520
Miss.                   1          3           1          2        433        551          77        141

W.S. CENTRAL           16         34          89         28      3,335      4,163       2,838      2,838
Ark.                    3          1          14         28        571        529         120        329
La.                    10         14           -          -        334        619         472        718
Okla.                   2          3          75          N        380        434         291        204
Tex.                    1         16           -          -      2,050      2,581       1,955      1,587

MOUNTAIN               41         60         177        233      2,646      2,235       2,200      1,797
Mont.                   4          1          54         51         53         72           1         43
Idaho                   3          8           -          N         99        108          81         85
Wyo.                    1          -          42         55         63         57          49         51
Colo.                  16         18           1         42        633        478         644        453
N. Mex.                 2         12           9          6        341        265         217        232
Ariz.                   8          8          58         47        836        723         692        613
Utah                    4          1           8         26        455        314         463        122
Nev.                    3         12           5          6        166        218          53        198

PACIFIC               221        233         314        372      4,709      5,026       3,995      4,859
Wash.                  25         17           -          -        577        438         670        577
Oreg.                  19         15           1          7        382        269         452        290
Calif.                166        194         306        342      3,399      4,023       2,610      3,697
Alaska                  1          2           7         23         51         53          15         32
Hawaii                 10          5           -          -        300        243         248        263

Guam                    -          2           -          -         24         34           U          U
P.R.                    -          -          63         47        255        694           U          U
V.I.                    U          U           U          U          U          U           U          U
Amer. Samoa             U          U           U          U          U          U           U          U
C.N.M.I.                U          U           U          U          U          U           U          U

--------------------------------------------------------------------------------------------------------
N: Not notifiable    U: Unavailable    -: no reported cases

* Individual cases may be reported through both the National Electronic Telecommunications System for Surveillance (NETSS)
  and the Public Health Laboratory Information System (PHLIS).
=======================================================================================================================================================

TABLE II. (page 4) Provisional cases of selected notifiable diseases, United States, weeks ending
November 6, 1999, and November 7, 1998 (44th Week)

                                  Shigellosis*
                    ---------------------------------------          Syphilis
                         NETSS                  PHLIS          (Primary & Secondary)      Tuberculosis
                    ----------------       ----------------    ---------------------    ------------------
                     Cum.       Cum.        Cum.       Cum.       Cum.       Cum.        Cum.       Cum.
Reporting Area       1999       1998        1999       1998       1999       1998        1999**     1998**
----------------------------------------------------------------------------------------------------------
UNITED STATES      13,368     18,442       6,167     10,449      5,709      6,105      11,715     14,211

NEW ENGLAND           642        378         638        331         50         65         353        378
Maine                   5         12           -          -          -          1          16         11
N.H.                   16         15          14         19          1          2          10          -
Vt.                     6          6           4          1          3          4           1          4
Mass.                 592        249         563        238         31         37         201        214
R.I.                   23         34           9         13          2          1          35         49
Conn.                   U         62          48         60         13         20          90        100

MID. ATLANTIC         806      2,115         398      1,565        218        272       2,118      2,474
Upstate N.Y.          246        533          45        188         24         35         266        325
N.Y. City             242        641          82        550         79         64       1,120      1,217
N.J.                  195        611         121        583         48         85         442        520
Pa.                   123        330         150        244         67         88         290        412

E.N. CENTRAL        2,424      2,506       1,121      1,342      1,326        890       1,106      1,407
Ohio                  370        435         116        117         75        124         200        204
Ind.                  280        143          90         36        592        170          82        131
Ill.                  919      1,377         592      1,122        451        363         495        665
Mich.                 388        236         255          4        208        176         246        316
Wis.                  467        315          68         63          U         57          83         91

W.N. CENTRAL          993        916         617        537        103        115         409        404
Minn.                 218        276         209        306          9          9         169        125
Iowa                   51         63          44         43          9          2          39         40
Mo.                   607        131         320         95         67         86         143        151
N. Dak.                 2          8           2          3          -          -           6          8
S. Dak.                13         31           6         21          -          1          17         16
Nebr.                  65        345           -         19          8          4          16         23
Kans.                  37         62          36         50         10         13          19         41

S. ATLANTIC         2,090      3,670         397      1,139      1,743      2,241       2,448      2,611
Del.                   12         34           8         28          8         20          12         32
Md.                   141        186          49         63        305        589         230        265
D.C.                   46         25           U          U         59         71          35         94
Va.                   117        177          48         80        136        132         247        250
W. Va.                  8         11           5          7          2          2          35         36
N.C.                  185        264          79        155        400        636         348        365
S.C.                  111        158          56         79        230        294         210        246
Ga.                   204        957          37        225        343        248         521        438
Fla.                1,266      1,858         115        502        260        249         810        885

E.S. CENTRAL          927      1,080         450        832        967      1,060         745      1,003
Ky.                   220        117           -         45         88         92         156        138
Tenn.                 508        490         393        572        532        498         272        355
Ala.                  106        423          47        208        190        247         261        323
Miss.                  93         50          10          7        157        223          56        187

W.S. CENTRAL        2,312      3,713       1,806      1,169        818        915       1,253      2,112
Ark.                   73        191          23         58         66        100         145        122
La.                   118        294          99        255        200        363           U        246
Okla.                 447        446         149        130        163         79         112        146
Tex.                1,674      2,782       1,535        726        389        373         996      1,598

MOUNTAIN              977      1,120         560        655        205        217         372        481
Mont.                   7          8           -          3          1          -          10         18
Idaho                  25         18           9         13          1          2          14         10
Wyo.                    3          3           1          1          -          1           3          4
Colo.                 169        186         123        143          2         10           U         56
N. Mex.               113        265          62        153         11         22          52         58
Ariz.                 524        546         341        295        182        163         183        187
Utah                   58         39          18         28          2          4          35         45
Nev.                   78         55           6         19          6         15          75        103

PACIFIC             2,197      2,944         180      2,879        279        330       2,911      3,341
Wash.                 101        191          79        163         63         27         151        227
Oreg.                  78        172          74        138          9          4          86        119
Calif.              1,989      2,527           -      2,527        204        295       2,481      2,797
Alaska                  3          8           2          5          1          1          48         46
Hawaii                 26         46          25         46          2          3         145        152

Guam                    8         34           U          U          1          1          11         78
P.R.                   62         53           U          U        140        158          41        140
V.I.                    U          U           U          U          U          U           U          U
Amer. Samoa             U          U           U          U          U          U           U          U
C.N.M.I.                U          U           U          U          U          U           U          U

----------------------------------------------------------------------------------------------------------
N: Not notifiable    U: Unavailable    -: no reported cases

 * Individual cases may be reported through both the National Electronic Telecommunications System for Surveillance (NETSS)
   and the Public Health Laboratory Information System (PHLIS).
** Cumulative reports of provisional tuberculosis cases for 1998 and 1999 are unavailable ('U') for some
   areas using the Tuberculosis Information Management System (TIMS).

=======================================================================================================================================================


Return to top.

Table III
Note: To print large tables and graphs users may have to change their printer settings to landscape and use a small font size.
TABLE III. (page 1) Provisional cases of selected notifiable diseases preventable by vaccination, United
States, weeks ending November 6, 1999, and November 7, 1998 (44th Week)

                                                Hepatitis (Viral), by type                                    Measles (Rubeola)
                     H. influenzae,       ---------------------------------------        ------------------------------------------------------------
                        invasive                  A                     B                  Indigenous            Imported*                 Total
                    ----------------      -----------------     -----------------        ---------------       ---------------        ---------------
                     Cum.       Cum.        Cum.       Cum.       Cum.       Cum.                   Cum.                  Cum.        Cum.       Cum.
Reporting Area       1999**     1998        1999       1998       1999       1998        1999       1999       1999       1999        1999       1998
-----------------------------------------------------------------------------------------------------------------------------------------------------
UNITED STATES         981        919      14,458     19,074      5,414      8,169           -         54          -         23          77         84

NEW ENGLAND            82         63         242        246         85        186           -          6          -          5          11          3
Maine                   7          3          11         17          1          4           -          -          -          -           -          -
N.H.                   17         10          15         12         13         18           -          -          -          1           1          -
Vt.                     5          8          18         15          3          8           -          -          -          -           -          1
Mass.                  31         36          78        109         34         67           -          5          -          3           8          2
R.I.                    5          5          21         15         34         63           -          -          -          -           -          -
Conn.                  17          1          99         78          -         26           -          1          -          1           2          -

MID. ATLANTIC         154        147         836      1,487        528      1,056           -          -          -          2           2         14
Upstate N.Y.           74         50         235        309        161        203           -          -          -          2           2          2
N.Y. City              34         39         244        518        168        368           -          -          -          -           -          -
N.J.                   45         50         112        309         41        183           -          -          -          -           -          8
Pa.                     1          8         245        351        158        302           -          -          -          -           -          4

E.N. CENTRAL          150        157       2,421      3,071        563      1,233           -          1          -          2           3         15
Ohio                   51         45         566        270         81         68           U          -          U          -           -          1
Ind.                   22         39         100        132         36         97           -          1          -          1           2          3
Ill.                   63         55         574        681          1        209           -          -          -          -           -          -
Mich.                  13         11       1,123      1,813        431        394           -          -          -          1           1         10
Wis.                    1          7          58        175         14        465           U          -          U          -           -          1

W.N. CENTRAL           84         83         750      1,228        313        351           -          2          -          -           2          -
Minn.                  40         64          75        115         49         43           -          1          -          -           1          -
Iowa                    9          2         123        388         34         51           -          -          -          -           -          -
Mo.                    26         10         451        573        188        210           -          1          -          -           1          -
N. Dak.                 1          -           2          3          -          4           -          -          -          -           -          -
S. Dak.                 1          -           9         31          1          2           U          -          U          -           -          -
Nebr.                   3          1          50         25         14         18           -          -          -          -           -          -
Kans.                   4          6          40         93         27         23           U          -          U          -           -          -

S. ATLANTIC           214        162       1,740      1,668      1,038        853           -         10          -          5          15          8
Del.                    -          -           2          3          1          3           U          -          U          -           -          1
Md.                    55         50         316        359        145        120           -          -          -          -           -          1
D.C.                    4          -          54         55         21         11           U          -          U          -           -          -
Va.                    17         16         149        182         77         90           -         10          -          3          13          2
W. Va.                  6          6          32          7         22          8           U          -          U          -           -          -
N.C.                   31         23         140        110        204        195           -          -          -          -           -          -
S.C.                    5          3          42         34         63         39           -          -          -          -           -          -
Ga.                    55         39         423        549        155        127           -          -          -          -           -          2
Fla.                   41         25         582        369        350        260           -          -          -          2           2          2

E.S. CENTRAL           52         53         339        352        347        435           -          2          -          -           2          2
Ky.                     6          7          61         29         37         42           -          2          -          -           2          -
Tenn.                  28         31         142        199        165        241           -          -          -          -           -          1
Ala.                   15         13          49         66         76         67           -          -          -          -           -          1
Miss.                   3          2          87         58         69         85           -          -          -          -           -          -

W.S. CENTRAL           45         48       3,481      3,419        773      1,813           -          8          -          4          12          -
Ark.                    2          -          50         78         58         95           -          3          -          -           3          -
La.                     7         20          73         92         77        145           U          -          U          -           -          -
Okla.                  32         25         402        520        110         87           -          -          -          -           -          -
Tex.                    4          3       2,956      2,729        528      1,486           -          5          -          4           9          -

MOUNTAIN               97        106       1,119      2,822        497        715           -          3          -          -           3          2
Mont.                   3          -          17         89         17          5           U          -          U          -           -          -
Idaho                   1          1          36        224         26         38           -          -          -          -           -          -
Wyo.                    1          1           7         35         12          9           -          -          -          -           -          -
Colo.                  11         21         197        281         82         93           -          -          -          -           -          -
N. Mex.                18          6          43        135        155        275           U          -          U          -           -          -
Ariz.                  52         54         657      1,687        130        159           -          1          -          -           1          2
Utah                    8          4          46        172         31         65           U          2          U          -           2          -
Nev.                    3         19         116        199         44         71           U          -          U          -           -          -

PACIFIC               103        100       3,530      4,781      1,270      1,527           -         22          -          5          27         40
Wash.                   5          8         286        884         60         95           -          -          -          -           -          1
Oreg.                  38         38         218        385         81        169           U          9          U          -           9          -
Calif.                 46         44       3,004      3,444      1,102      1,237           -         13          -          4          17          8
Alaska                  6          3           9         16         14         13           -          -          -          -           -         31
Hawaii                  8          7          13         52         13         13           -          -          -          1           1          -

Guam                    -          -           2          1          2          2           U          1          U          -           1          -
P.R.                    1          2         112         63        102        220           -          -          -          -           -          -
V.I.                    U          U           U          U          U          U           U          U          U          U           U          U
Amer. Samoa             U          U           U          U          U          U           U          U          U          U           U          U
C.N.M.I.                U          U           U          U          U          U           U          U          U          U           U          U
-----------------------------------------------------------------------------------------------------------------------------------------------------
N: Not notifiable    U: Unavailable     -: no reported cases

 * For imported measles, cases include only those resulting from importation from other countries.
** Of 187 cases among children aged <5 years, serotype was reported for 98 and of those, 26 were type b.
=======================================================================================================================================================

TABLE III. (page 2) Provisional cases of selected notifiable diseases preventable by vaccination, United
States, weeks ending November 6, 1999, and November 7, 1998 (44th Week)

                     Meningococcal
                        Disease                      Mumps                           Pertussis                          Rubella
                   -----------------        --------------------------       ---------------------------       ---------------------------
                     Cum.       Cum.                   Cum.       Cum.                   Cum.       Cum.                  Cum.        Cum.
Reporting Area       1999       1998        1999       1999       1998       1999        1999       1998       1999       1999        1998
------------------------------------------------------------------------------------------------------------------------------------------
UNITED STATES       2,020      2,263           6        296        577         57       4,718      5,584          1        227         345

NEW ENGLAND           100        103           -          8          8          8         558        888          -          7          38
Maine                   5          6           -          -          -          -           -          5          -          -           -
N.H.                   12         11           -          1          -          -          78        103          -          -           -
Vt.                     5          5           -          1          -          3          60         69          -          -           -
Mass.                  58         49           -          4          5          -         360        662          -          7           8
R.I.                    5          7           -          2          1          -          33          9          -          -           1
Conn.                  15         25           -          -          2          5          27         40          -          -          29

MID. ATLANTIC         185        242           -         30        184         32         780        560          -         22         146
Upstate N.Y.           58         65           -         10          6         32         645        291          -         18         114
N.Y. City              46         30           -          3        155          -          10         37          -          -          18
N.J.                   44         55           -          -          6          -          12         24          -          1          13
Pa.                    37         92           -         17         17          -         113        208          -          3           1

E.N. CENTRAL          347        348           -         34         74          4         415        725          -          2           -
Ohio                  122        125           U         14         27          U         184        247          U          -           -
Ind.                   58         63           -          4          7          1          63        149          -          1           -
Ill.                   93         87           -          9         10          1          66        106          -          1           -
Mich.                  42         42           -          7         27          2          54         59          -          -           -
Wis.                   32         31           U          -          3          U          48        164          U          -           -

W.N. CENTRAL          223        195           -         13         31          1         335        511          1        124          39
Minn.                  49         30           -          1         13          -         187        291          -          5           -
Iowa                   40         38           -          7         10          1          49         66          -         29           -
Mo.                    90         70           -          2          3          -          51         35          1          3           2
N. Dak.                 3          5           -          -          2          -           4          3          -          -           -
S. Dak.                11          7           U          -          -          U           5          8          U          -           -
Nebr.                  12         15           -          -          -          -           4         16          -         87           -
Kans.                  18         30           U          3          3          U          35         92          U          -          37

S. ATLANTIC           356        374           1         47         45          2         359        279          -         36          18
Del.                    8          2           U          -          -          U           5          5          U          -           -
Md.                    51         27           1          6          -          1          98         55          -          1           1
D.C.                    1          1           U          2          -          U           -          1          U          -           -
Va.                    47         36           -         10          8          -          29         30          -          -           1
W. Va.                  6         16           U          -          -          U           3          1          U          -           -
N.C.                   40         53           -          8         11          -          86         91          -         35          13
S.C.                   42         52           -          4          6          -          15         26          -          -           -
Ga.                    58         86           -          4          1          1          38         24          -          -           -
Fla.                  103        101           -         13         19          -          85         46          -          -           3

E.S. CENTRAL          125        177           1         13         15          -          72        112          -          1           2
Ky.                    28         33           -          -          -          -          21         49          -          -           -
Tenn.                  43         63           -          -          1          -          27         33          -          -           2
Ala.                   32         47           1         10          8          -          21         24          -          1           -
Miss.                  22         34           -          3          6          -           3          6          -          -           -

W.S. CENTRAL          166        269           -         33         55          1         157        333          -         15          87
Ark.                   31         27           -          -         12          -          18         77          -          6           -
La.                    34         52           U          3          7          U           3          9          U          -           -
Okla.                  27         38           -          1          -          -          12         31          -          -           -
Tex.                   74        152           -         29         36          1         124        216          -          9          87

MOUNTAIN              125        127           1         26         36          8         619        963          -         16           5
Mont.                   2          4           U          -          -          U           2          9          U          -           -
Idaho                  10         10           1          2          4          4         139        215          -          -           -
Wyo.                    4          5           -          -          1          -           2          8          -          -           -
Colo.                  32         23           -          5          6          4         183        243          -          1           -
N. Mex.                14         25           N          N          N          U         133         89          U          -           1
Ariz.                  42         39           -          8          6          -         100        191          -         13           1
Utah                   14         13           U          6          5          U          55        167          U          1           2
Nev.                    7          8           U          5         14          U           5         41          U          1           1

PACIFIC               393        428           3         92        129          1       1,423      1,213          -          4          10
Wash.                  61         58           -          2         10          1         594        284          -          -           5
Oreg.                  69         74           N          N          N          U          47         85          U          -           -
Calif.                251        288           3         76         93          -         745        813          -          4           3
Alaska                  5          3           -          2          2          -           4         14          -          -           -
Hawaii                  7          5           -         12         24          -          33         17          -          -           2

Guam                    2          2           U          1          5          U           1          1          U          -           -
P.R.                    5          9           -          -          3          -          16          6          -          -          14
V.I.                    U          U           U          U          U          U           U          U          U          U           U
Amer. Samoa             U          U           U          U          U          U           U          U          U          U           U
C.N.M.I.                U          U           U          U          U          U           U          U          U          U           U

------------------------------------------------------------------------------------------------------------------------------------------
N: Not notifiable    U: Unavailable     -: no reported cases

=======================================================================================================================================================


Return to top.

Table IV
Note: To print large tables and graphs users may have to change their printer settings to landscape and use a small font size.
TABLE IV. Deaths in 122 U.S. cities,* week ending
November 6, 1999 (44th Week)
===================================================================================================================================
                                                 All Causes, By Age (Years)
                          ------------------------------------------------------------------------        P&I**
Reporting Area            All Ages         >=65        45-64       25-44         1-24           <1        Total
---------------------------------------------------------------------------------------------------------------
NEW ENGLAND                    261          186           44          22            4            5           29
Boston, Mass.                    U            U            U           U            U            U            U
Bridgeport, Conn.                U            U            U           U            U            U            U
Cambridge, Mass.                11            8            1           2            -            -            3
Fall River, Mass.               27           23            3           -            1            -            6
Hartford, Conn.                  U            U            U           U            U            U            U
Lowell, Mass.                   16           13            3           -            -            -            3
Lynn, Mass.                     13            7            4           2            -            -            1
New Bedford, Mass.              23           16            3           3            1            -            1
New Haven, Conn.                46           25           11           8            1            1            3
Providence, R.I.                62           41           13           5            -            3            5
Somerville, Mass.                2            2            -           -            -            -            -
Springfield, Mass.              40           32            4           2            1            1            3
Waterbury, Conn.                21           19            2           -            -            -            4
Worcester, Mass.                 U            U            U           U            U            U            U

MID. ATLANTIC                  995          725          170          61           18           20           56
Albany, N.Y.                    41           29            8           2            1            1            5
Allentown, Pa.                   U            U            U           U            U            U            U
Buffalo, N.Y.                   80           60           12           5            1            1            6
Camden, N.J.                    20           14            4           1            1            -            -
Elizabeth, N.J.                 13           11            -           2            -            -            -
Erie, Pa.                       49           35            4           6            -            4            4
Jersey City, N.J.               54           38           10           6            -            -            -
New York City, N.Y.              U            U            U           U            U            U            U
Newark, N.J.                     U            U            U           U            U            U            U
Paterson, N.J.                  27           18            6           1            -            2            -
Philadelphia, Pa.              389          267           79          25           11            7           14
Pittsburgh, Pa.***              48           28           11           5            1            3            2
Reading, Pa.                    31           29            2           -            -            -            5
Rochester, N.Y.                109           85           15           4            3            2           11
Schenectady, N.Y.                U            U            U           U            U            U            U
Scranton, Pa.                   28           25            2           1            -            -            1
Syracuse, N.Y.                  70           57           11           2            -            -            7
Trenton, N.J.                   15           12            2           1            -            -            1
Utica, N.Y.                     21           17            4           -            -            -            -
Yonkers, N.Y.                    U            U            U           U            U            U            U

E.N. CENTRAL                 1,910        1,322          363         144           42           37          131
Akron, Ohio                     39           31            2           5            1            -            2
Canton, Ohio                    36           29            4           2            -            1            3
Chicago, Ill.                  362          206           83          47           13           11           36
Cincinnati, Ohio                65           42           15           3            1            4            2
Cleveland, Ohio                124           87           30           4            2            1            2
Columbus, Ohio                 191          139           32          15            2            3           11
Dayton, Ohio                   121           90           22           8            -            1           10
Detroit, Mich.                 200          117           55          18            6            4           15
Evansville, Ind.                47           37            8           2            -            -            3
Fort Wayne, Ind.                53           42            9           1            1            -            7
Gary, Ind.                      23           12            4           3            3            1            1
Grand Rapids, Mich.             43           37            5           -            1            -            3
Indianapolis, Ind.             143           98           25          12            4            4           10
Lansing, Mich.                  26           18            7           1            -            -            2
Milwaukee, Wis.                112           89           14           8            -            1            -
Peoria, Ill.                    45           34            6           2            1            2            5
Rockford, Ill.                  65           52            8           3            2            -            5
South Bend, Ind.                59           40           11           3            1            4            3
Toledo, Ohio                    92           70           15           5            2            -            8
Youngstown, Ohio                64           52            8           2            2            -            3

W.N. CENTRAL                   446          323           72          29            9           13           31
Des Moines, Iowa                 U            U            U           U            U            U            U
Duluth, Minn.                   30           24            5           -            -            1            4
Kansas City, Kans.              35           21            7           5            1            1            3
Kansas City, Mo.                87           56           11          10            5            5            5
Lincoln, Nebr.                  38           30            4           4            -            -            1
Minneapolis, Minn.             146          105           28           7            2            4            9
Omaha, Nebr.                     U            U            U           U            U            U            U
St. Louis, Mo.                   U            U            U           U            U            U            U
St. Paul, Minn.                 58           51            6           1            -            -            6
Wichita, Kans.                  52           36           11           2            1            2            3

S. ATLANTIC                    777          494          170          68           31           13           51
Atlanta, Ga.                     U            U            U           U            U            U            U
Baltimore, Md.                 150           80           36          22           10            2           12
Charlotte, N.C.                 83           51           22           5            4            1            7
Jacksonville, Fla.             116           73           29           7            4            3            4
Miami, Fla.                      U            U            U           U            U            U            U
Norfolk, Va.                    42           28           11           -            3            -            1
Richmond, Va.                   63           33           19           9            -            2            5
Savannah, Ga.                   50           39            7           1            2            1            3
St. Petersburg, Fla.            98           71           12           9            4            2            5
Tampa, Fla.                    145           98           25          15            4            2           14
Washington, D.C.                 U            U            U           U            U            U            U
Wilmington, Del.                30           21            9           -            -            -            -

E.S. CENTRAL                   794          530          177          60           14           11           73
Birmingham, Ala.               173          114           43          10            5            1           17
Chattanooga, Tenn.              75           50           17           5            2            1            5
Knoxville, Tenn.                97           67           21           5            2            2           10
Lexington, Ky.                  70           48           15           3            1            2           10
Memphis, Tenn.                 196          134           37          20            2            3           18
Mobile, Ala.                    62           41           13           7            -            1            1
Montgomery, Ala.                 U            U            U           U            U            U            U
Nashville, Tenn.               121           76           31          10            2            1           12

W.S. CENTRAL                 1,338          894          280          88           31           45          113
Austin, Tex.                    70           48           15           5            1            1            5
Baton Rouge, La.                11           10            1           -            -            -            1
Corpus Christi, Tex.            60           46           10           2            2            -           10
Dallas, Tex.                   184          111           47          12            5            9           13
El Paso, Tex.                   76           54           15           1            4            2            7
Ft. Worth, Tex.                127           84           29           9            2            3           10
Houston, Tex.                  336          203           79          29           10           15           34
Little Rock, Ark.               81           52           19           5            2            3            3
New Orleans, La.                 U            U            U           U            U            U            U
San Antonio, Tex.              222          161           38          17            3            3           13
Shreveport, La.                 49           35            5           5            1            3            5
Tulsa, Okla.                   122           90           22           3            1            6           12

MOUNTAIN                       807          544          172          58           19           13           62
Albuquerque, N.M.              107           74           18          10            3            2            6
Boise, Idaho                    47           34           10           3            -            -            3
Colo. Springs, Colo.            65           41           16           5            1            2            7
Denver, Colo.                    U            U            U           U            U            U            U
Las Vegas, Nev.                156          104           36          11            2            2           11
Ogden, Utah                      U            U            U           U            U            U            U
Phoenix, Ariz.                 168          101           40          16            7            4           13
Pueblo, Colo.                   43           29            9           3            2            -            2
Salt Lake City, Utah            87           66           15           3            2            1           10
Tucson, Ariz.                  134           95           28           7            2            2           10

PACIFIC                      1,113          783          197          90           23           18           78
Berkeley, Calif.                 U            U            U           U            U            U            U
Fresno, Calif.                 111           82           17           7            5            -           11
Glendale, Calif.                 U            U            U           U            U            U            U
Honolulu, Hawaii                70           46           10           9            1            4            7
Long Beach, Calif.              49           36            8           1            2            2            6
Los Angeles, Calif.              U            U            U           U            U            U            U
Pasadena, Calif.                21           19            2           -            -            -            5
Portland, Oreg.                  U            U            U           U            U            U            U
Sacramento, Calif.               U            U            U           U            U            U            U
San Diego, Calif.              382          283           61          29            4            3            7
San Francisco, Calif.            U            U            U           U            U            U            U
San Jose, Calif.               151          107           21          14            4            5           16
Santa Cruz, Calif.              27           17            6           2            2            -            3
Seattle, Wash.                 139           75           44          17            1            2            8
Spokane, Wash.                  63           49            7           6            1            -            4
Tacoma, Wash.                  100           69           21           5            3            2           11

TOTAL                    8,441****        5,801        1,645         620          191          175          624

---------------------------------------------------------------------------------------------------------------
U: Unavailable    -: no reported cases

   * Mortality data in this table are voluntarily reported from 122 cities in the United States, most of which have populations
     of 100,000 or more. A death is reported by the place of its occurrence and by the week that the death certificate was
     filed. Fetal deaths are not included.
  ** Pneumonia and influenza.
 *** Because of changes in reporting methods in this Pennsylvania city, these numbers are partial counts for the current
     week. Complete counts will be available in 4 to 6 weeks.
**** Total includes unknown ages.
===================================================================================================================================


Return to top.

Disclaimer   All MMWR HTML versions of articles are electronic conversions from ASCII text into HTML. This conversion may have resulted in character translation or format errors in the HTML version. Users should not rely on this HTML document, but are referred to the electronic PDF version and/or the original MMWR paper copy for the official text, figures, and tables. An original paper copy of this issue can be obtained from the Superintendent of Documents, U.S. Government Printing Office (GPO), Washington, DC 20402-9371; telephone: (202) 512-1800. Contact GPO for current prices.

**Questions or messages regarding errors in formatting should be addressed to mmwrq@cdc.gov.

Page converted: 11/10/99

HOME  |  ABOUT MMWR  |  MMWR SEARCH  |  DOWNLOADS  |  RSSCONTACT
POLICY  |  DISCLAIMER  |  ACCESSIBILITY

Safer, Healthier People

Morbidity and Mortality Weekly Report
Centers for Disease Control and Prevention
1600 Clifton Rd, MailStop E-90, Atlanta, GA 30333, U.S.A

USA.GovDHHS

Department of Health
and Human Services

This page last reviewed 5/2/01